.webp)
Introduction: Q4 sales land in Q1 returns
The holiday quarter is two ledgers, not one. Q4 carries the revenue. Q1 carries the returns, the warranty claims, the chargebacks, the supplier-recovery work and the customer-service backlog. Most plans focus on the revenue side. The returns side gets handled with overtime and panic hiring.
The better plan treats peak returns as a margin and headcount defence problem. The brands running this right scale claim volume two or three times without adding heads, recover supplier credit on defective peak SKUs while the data is fresh, and end January with the queue clear instead of two months behind. This guide walks the pre-peak prep, the in-peak operations, and the post-peak recovery plan with dollar and headcount specifics, building on the operational lens in average ecommerce return rates and returns and warranty KPIs.
- Q4 returns hit the P&L in late December through February. Plan headcount, supplier-recovery cycles and customer comms for the Q1 wave, not the Q4 wave.
- Brands using a structured pre-peak checklist scale claim volume two to three times without adding agents.
- Peak-defect SKUs surface fast under structured intake. Run supplier-recovery cycles weekly through January, not in March when the data is cold.
- Claimlane runs claim execution during peak as the engine behind the customer-facing returns layer, with structured intake and automated supplier routing.
What "holiday returns management" actually means
Holiday returns management is the set of operations, policy and tooling decisions that absorb the December-through-February returns and warranty wave following Q4 sales, with the goal of maintaining service levels and margin without scaling headcount linearly with volume.
The distinction from regular returns work is volume, mix and time pressure. The volume can be three times a normal month. The mix skews toward gifts, size and fit issues, and category-specific defect spikes on the SKUs that sold hardest. The time pressure is real: the customer expects January resolution on a December purchase. Slip the SLA and the chargeback risk goes up sharply. The broader operational view is in ecommerce returns and return processing times.
The January spike: how bad it actually gets
NRF data shows post-holiday return rates running 17-25% across ecommerce, against an annual baseline closer to 14-16%. Apparel, electronics and home goods carry the heaviest spikes. Gift returns add a category most return policies handle poorly: no original order ID, no buyer-side payment method, no shipping address that matches the recipient. The pattern is documented in consumer buying behavior and returns and the broader category-shaped read in average ecommerce return rates.
Three dynamics make January harder than the rate alone suggests. Each one compounds.
The defect surface widens. SKUs that sold heavily in Q4 surface their quality issues in January claims. Brands without structured defect tracking miss the supplier-recovery window. Pattern in serialized product defect tracking.
The team gets diluted. Holiday hires are still ramping. Permanent staff are coming back from PTO. Process knowledge spreads thin right when complexity peaks.
The customer baseline drops. People returning gifts they did not pick are less patient than people returning items they chose. Sentiment baseline is lower, which raises escalation rates.
Pre-peak prep checklist
The prep window is October through mid-November. Twelve items handle most of the operational risk.
- Audit the returns portal for gift-return paths (no order ID needed, recipient address only).
- Extend the published return window for orders placed November 15 onward through end of January.
- Pre-stage shipping labels and carrier capacity with the 3PL.
- Confirm warranty terms on top-50 Q4 SKUs and load them into the policy engine.
- Set up supplier-recovery batch cycles to run weekly starting January 5.
- Update the customer-facing FAQ and policy page with peak SLAs.
- Stress-test the claims portal for two and three times normal load.
- Brief the support team on top-10 expected dispute scenarios.
- Run a fraud-rule review (Q4 fraud patterns differ from baseline).
- Build a January dashboard that tracks SLA, supplier recovery and escalation rate daily.
- Confirm finance has the reserve sized for the expected return mix.
- Activate automated status emails for every claim status change.
Two of those items carry most of the operational weight: extending the return window and pre-staging supplier-recovery cycles. Both are covered below.
Extending return windows: when and how
Most ecommerce brands extend the return window by 15-30 days for Q4 purchases. The mechanics matter more than the duration.
Apply the extension automatically. The portal should detect the order date and apply the extended window without the customer asking. Customers who have to email to request an extension generate avoidable tickets.
Publish the policy clearly. The customer should see the extended date on the order confirmation, the shipping email and the help center. The pattern is documented in shopify return policies templates and shopify returns.
Keep warranty terms separate. The extended window is for change of mind and gift returns. Warranty terms run on their own calendar tied to product type. Mixing the two creates customer expectations the policy cannot meet. Background view in ecommerce return policy strategies and the practical templates in return policy templates ecommerce.
Offer store credit or exchange as the default for gift returns. The gift recipient often wants the brand, not the refund. Pattern in exchange policies ecommerce stores and store credit vs refund.
Headcount avoided: scaling the team without hiring
The biggest peak cost is not the SKU write-off. It is the seasonal headcount. Adding three to five seasonal claims agents through January is six-figure money for mid-market brands, and the ramp time eats half the value.
Four levers reduce the headcount need.
The claims portal deflects 60-80% of contacts when it captures photo evidence, serial numbers and reason codes at the start.
Workflows that match claim type to disposition route 70%+ of straightforward cases without an agent touch.
Automated status emails on every state change kill the WISMO and WIMR (where is my refund) ticket layer.
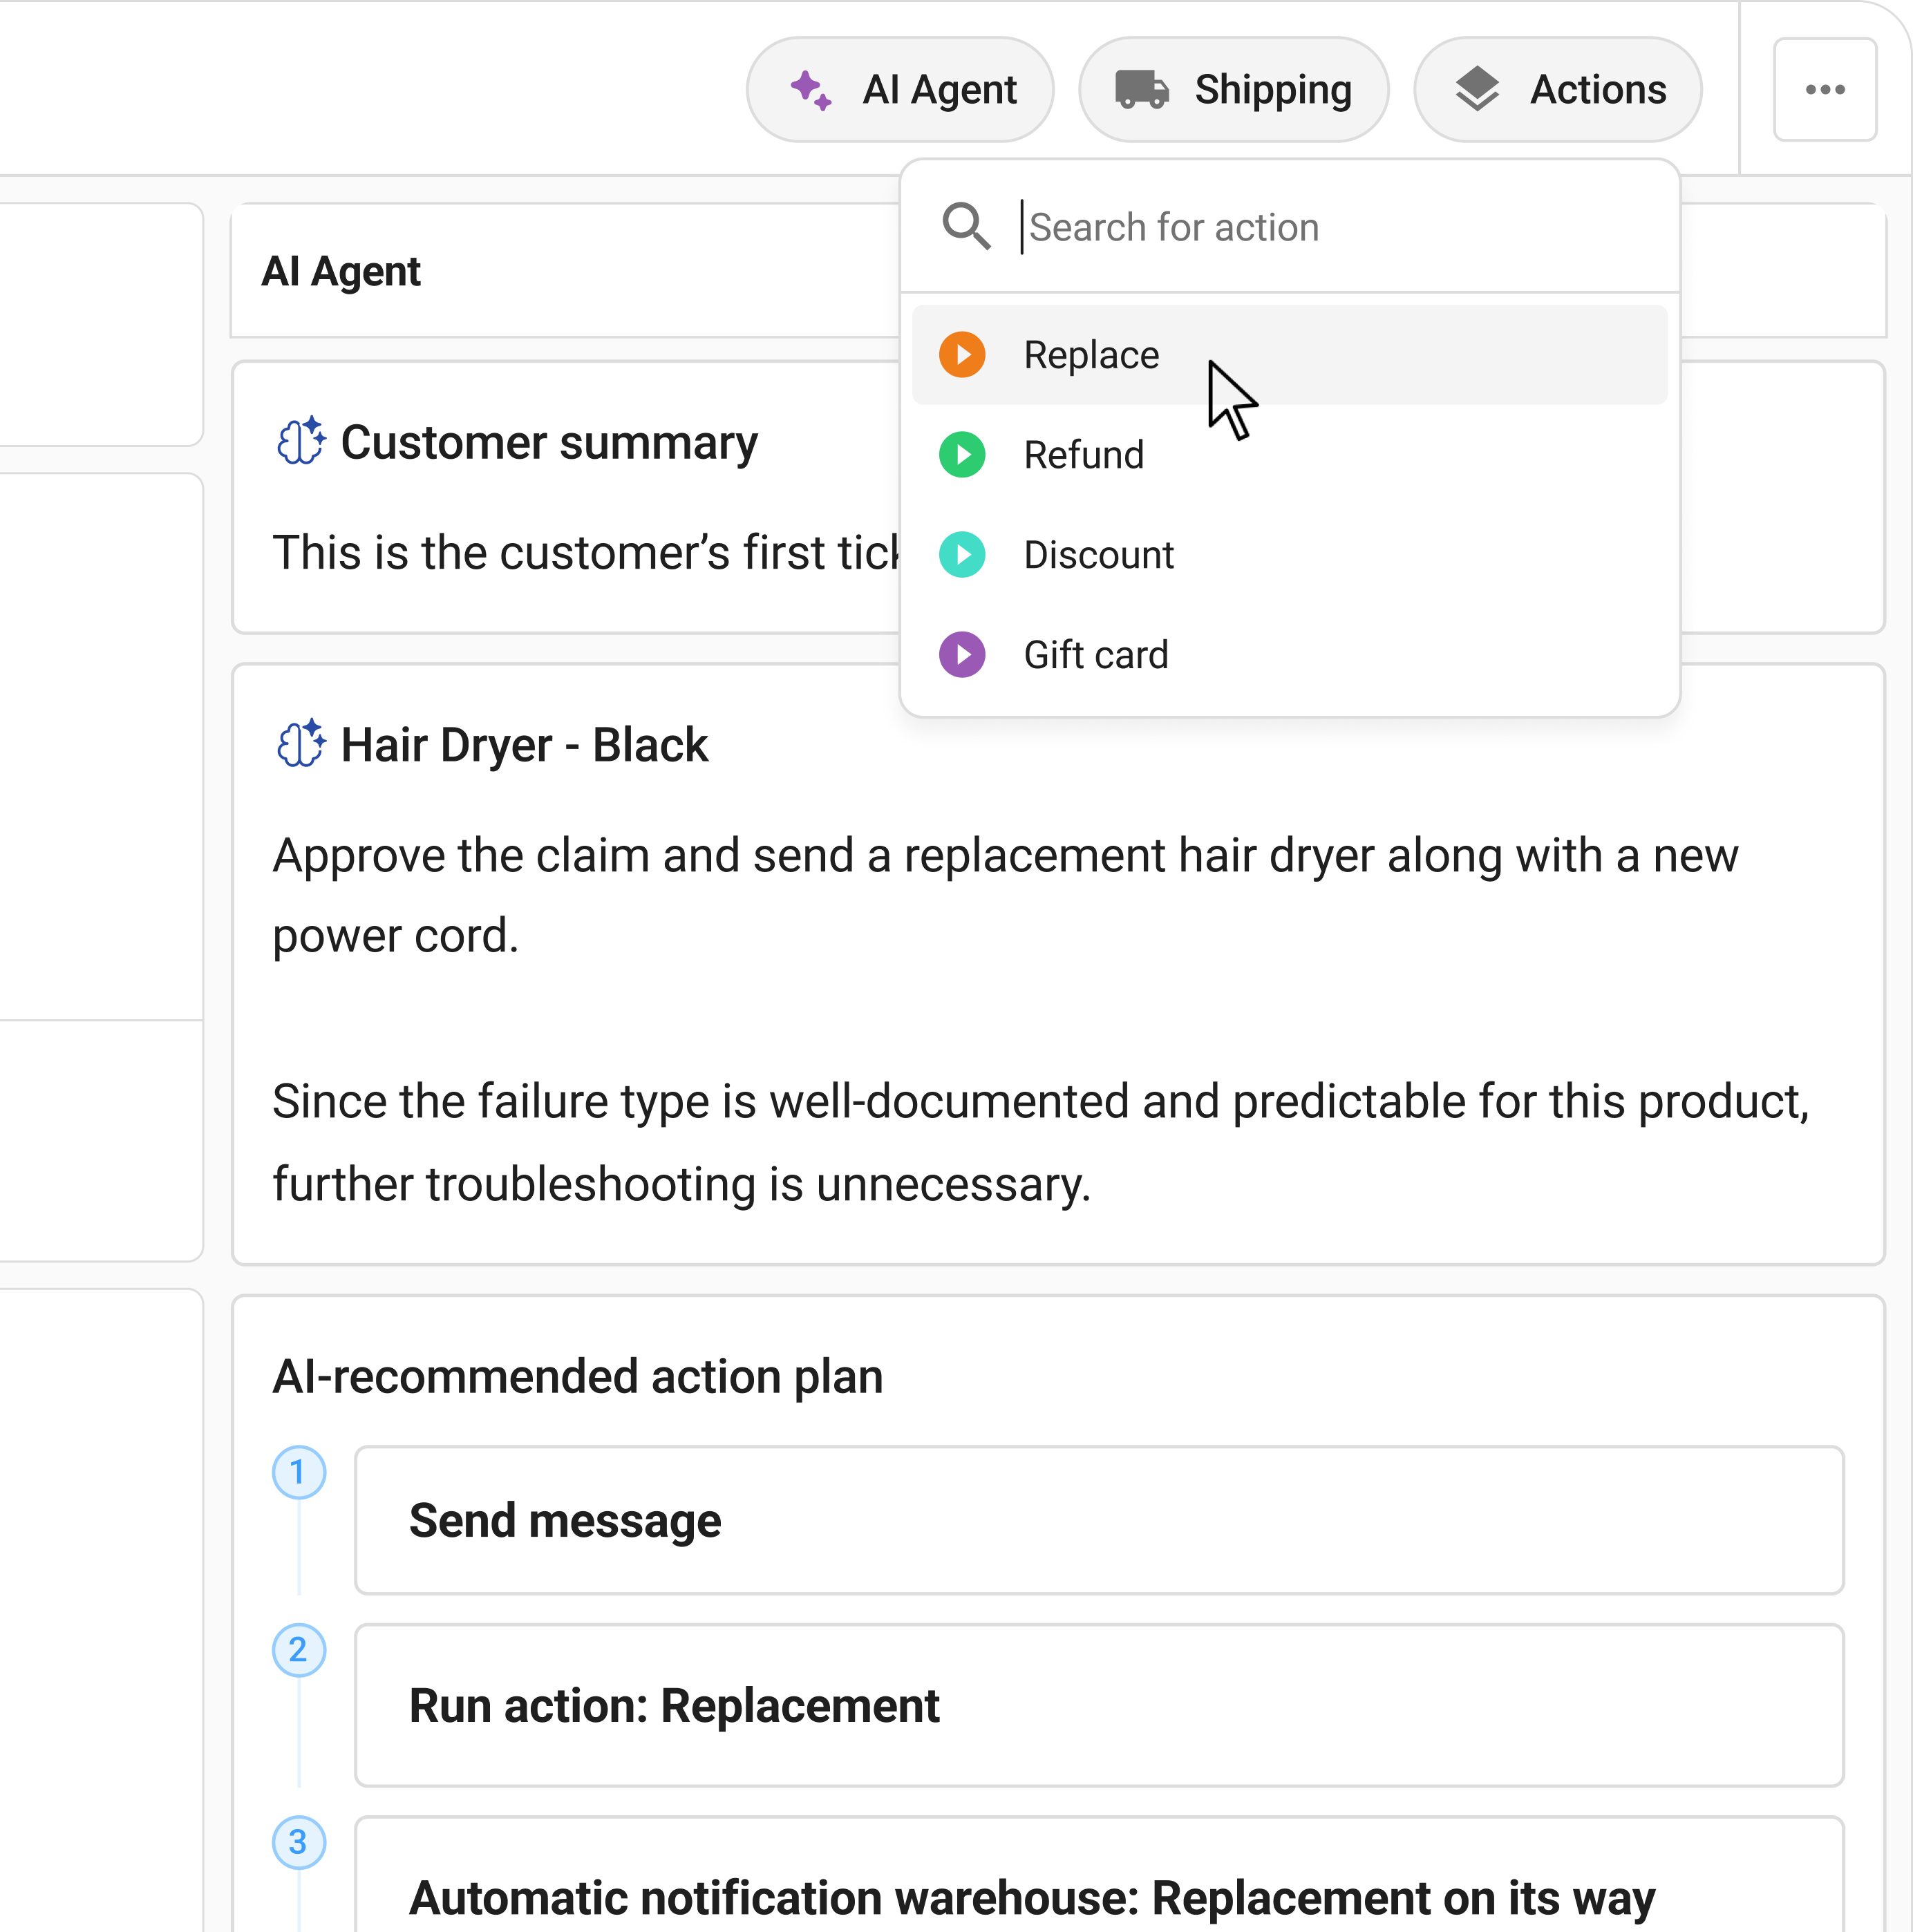
A claims-specialist agent handles routine decisions and routes hard cases to humans with full context attached.
The WISMO and WIMR layer alone often saves an agent or two. Reference pattern in reduce where is my order queries, notify customers returns process and automatic status emails.
“January used to mean two extra agents and a backlog. The first peak we ran with Claimlane on the claim side, we kept the same headcount and cleared the queue by week three.
Davidsen's full operational journey, from five claims agents to one or two, is documented at Davidsen. The pattern repeats in retailers like Coolshop on consumer electronics returns.
Supplier recovery on peak-defect SKUs
The supplier-recovery window opens in December and closes fast. Defect-coded claims attached to specific SKUs and lots get accepted by suppliers when the data is fresh. Run the recovery cycle in March, the same claims get pushed back. Three operational rules.
Run supplier-recovery batches weekly through January. Not monthly, not quarterly. Weekly. The defect data quality compounds with frequency. The mechanics are in supplier recovery how to get credit notes faster and supplier chargebacks.
Attach photo evidence and serial data to every defect claim. Recovery on photo-and-serial packets runs much higher than on text-only claims. The image work is detailed in AI image recognition warranty claims.
Use the supplier portal handoff. The Forward to supplier workflow pushes the structured packet to the supplier directly, with the defect code, the order data and the evidence attached. Suppliers process those faster than email PDFs.
The deeper context on why this matters is in warranty analytics product quality and the broader supplier view in supplier management ecommerce.
The misclassified warranty vs return problem at peak
During peak volume, agents under time pressure misclassify claims. Warranty issues get coded as change-of-mind returns. Damaged-in-transit gets coded as defect. The cost lands on the wrong owner. Three downstream effects:
Supplier recovery misses the defect. Items coded as change-of-mind never reach the supplier portal.
Warranty exposure goes underreported. Finance reserves for returns are easier to model than warranty reserves; misclassification hides real warranty cost.
Product quality data degrades. Defect signals on Q4 SKUs disappear into the change-of-mind bucket.
The defence is structured intake: the portal asks the right questions, the AI agent triages correctly, and the human only handles the edge cases. The architecture view is in warranty claims processing and warranty management best practices.
Customer comms during peak: WISMO plus claim status
Customer-facing comms run on two tracks during peak: pre-resolution status and post-resolution confirmation.
Pre-resolution status emails kill the inbound query layer. The customer who knows their claim is at step three of six does not email asking. The architecture sits inside the self-service portal and the broader pattern is in reduce where is my order queries.
Post-resolution confirmations close the loop. A claim resolved without a clear closure email gets followed up by the customer, generating an avoidable touch. Pattern in returns end delays for complex warranty claims.
For B2B accounts, the comm cadence is different: longer threads, more stakeholders, more sensitivity to delays. The dual approach lives in hybrid B2C/B2B claims management.
Peak fraud: what changes during the holidays
Fraud patterns shift in Q4 and Q1. Three categories spike.
Wardrobing: high-end apparel and gear bought for events, returned right after. Volume rises in late November and December.
Gift-claim collusion: an item bought as a gift, returned by the recipient, refunded to the buyer, then both keep value somehow. Often technical-policy abuse rather than overt fraud.
False damage claims: legitimate-looking damaged-on-arrival claims spike when carrier strain raises real damage rates, providing cover for false ones.
The defence layer is rules plus image evidence plus customer history. Mechanics in return fraud prevention and return fraud in ecommerce. At peak, the rules engine should err toward routing to human review rather than auto-denying, because false denial costs the customer relationship.
Post-peak recovery plan: February to March
The post-peak plan has three priorities.
Close the supplier-recovery loop. Convert every defect claim from December and January into either a credit memo (issued and recorded) or an explicit write-off. Items that sit in limbo lose recovery value every week. The full sequence sits in supplier recovery how to get credit notes faster.
Run the post-mortem on SKU performance. Which SKUs over-returned, which over-defected, which over-claimed warranty. The decisions inform Q3 reorder and Q4 next year. Pattern in predictive returns analytics for ecommerce.
Reset the team and the policy. Decompress staffing, capture process improvements, update the playbook for next year. The discipline shows up in audit your returns process.
Peak-specific KPIs and the dashboard view
The in-peak dashboard tracks five things. Daily, not weekly.
Dashboard build-out follows the events model in returns analytics events.
Tools that handle peak volume
Four categories handle peak. Customer-facing returns layer (Shopify, Loop, ReturnGO). Conversation layer (Zendesk, Gorgias). Claims and warranty execution (Claimlane). Reverse logistics (3PLs, carrier portals). Mid-market brands often need all four working together, with structured handoffs.
The single highest-leverage piece during peak is the claim-execution layer. That is where the decision lives, where the supplier-recovery loop runs, and where the misclassification problem either gets solved or compounded. Comparison context in best returns software ecommerce and best claims management software.
Verified G2 reviewers cite peak-handling, supplier recovery and claim cycle time as the standout strengths.
Claimlane scores 4.8/5 on G2 across returns and warranty categories.
Where Claimlane fits in the peak stack
Claimlane runs the claim-execution layer for peak. Structured intake at the self-service portal captures the photo, the serial, the reason code and the order ID at the front. Workflows route based on claim type, value and policy fit. Forward to supplier pushes the recovery packet weekly through January. Analytics feeds the daily dashboard.
The pattern sits naturally behind the customer-facing returns layer (Shopify, Loop) and the support layer (Zendesk, Gorgias), so the brand keeps its existing CX investment while the claim execution engine carries the peak load. Documented in returns management system Shopify and how to automate returns.
See how Claimlane absorbs peak claims volume without adding heads. Book a 30-minute walkthrough.
FAQ
Conclusion: peak is a margin defence, not a customer-service exercise
Holiday returns are an operational stress test that lands on Q1 P&L. The brands handling them well treat the season as a structured project: pre-peak prep through October and November, structured intake and triage in December and January, weekly supplier-recovery batches, and a clean post-mortem in February.
The lever that compounds is structured intake. Photo and serial capture at the front, AI triage and routing in the middle, automated status comms throughout, supplier-recovery batches running weekly. Brands that build that pattern absorb peak without scaling headcount linearly with volume.
See how Claimlane runs the claim-execution layer through peak. Book a 30-minute walkthrough.