.webp)
Every warranty claim tells a story. A cracked handle on a kitchen pan. A zipper that fails after three months. A battery that drains twice as fast as it should. Individually, these incidents feel random. Collectively, they reveal patterns that can reshape how products are designed, sourced, and manufactured.
Warranty analytics turns raw claims data into structured insight. Instead of treating each claim as a cost to absorb, brands that analyze warranty data systematically can trace defects back to specific suppliers, materials, or production batches and fix the root cause before it becomes a recurring problem.
This guide breaks down how warranty analytics works, which metrics matter most, and how leading ecommerce and retail brands use claims data to improve product quality at every stage of the supply chain.
- Warranty analytics identifies recurring product defects by aggregating claims data across SKUs, suppliers, and time periods.
- Tracking metrics like claim rate per SKU, mean time to failure, and defect type distribution reveals quality issues before they scale.
- Brands that feed warranty data back to suppliers and product teams reduce repeat claims by 20-40% within two quarters.
- Claimlane's analytics dashboard gives brands real-time visibility into defect patterns, supplier performance, and claim costs so teams can act on data instead of guesswork.
What Is Warranty Analytics?
Warranty analytics is the practice of collecting, structuring, and analyzing data from warranty claims to uncover patterns in product failures, defect types, and resolution outcomes. It goes beyond counting how many claims came in last month. The goal is to answer questions like:
- Which products fail most often, and why?
- Are certain suppliers linked to higher defect rates?
- How long do products last before the first claim?
- What does each claim actually cost the business?
Traditionally, this data lived in spreadsheets, email threads, and disconnected ticketing systems. Modern warranty management platforms centralize it so teams can query, filter, and visualize trends without manual data wrangling.
The difference between a brand that reacts to quality problems and one that prevents them often comes down to whether warranty data is treated as an operational byproduct or a strategic asset.
How Warranty Analytics Differs from Returns Analytics
Returns analytics focuses on why customers send products back (wrong size, changed mind, not as described). Warranty analytics focuses on why products fail (material defect, manufacturing error, design flaw). Both matter, but they answer different questions and require different data structures. For a deeper look at returns-side metrics, see this guide on returns analytics events to track.
Why Warranty Data Matters for Product Quality
Product teams often rely on pre-launch testing to catch quality issues. But lab conditions rarely replicate real-world usage. A hiking boot tested on a treadmill behaves differently on a muddy trail in Scotland.
Warranty claims capture what happens after the product reaches the customer. They reveal failure modes that testing missed, usage patterns that accelerate wear, and environmental factors that degrade materials faster than expected.
The Feedback Loop Most Brands Miss
The problem is that most brands never close the loop. Claims data stays in the customer service department. Product teams never see it. Suppliers never hear about it. The same defect keeps generating claims quarter after quarter.
Brands that build a structured feedback loop from warranty claims back to product development and supplier management break this cycle. They use claims data to:
- Prioritize which quality issues to fix first (based on volume and cost)
- Hold suppliers accountable with defect-rate benchmarks
- Validate whether design changes actually reduced failure rates
- Forecast warranty costs for new product launches
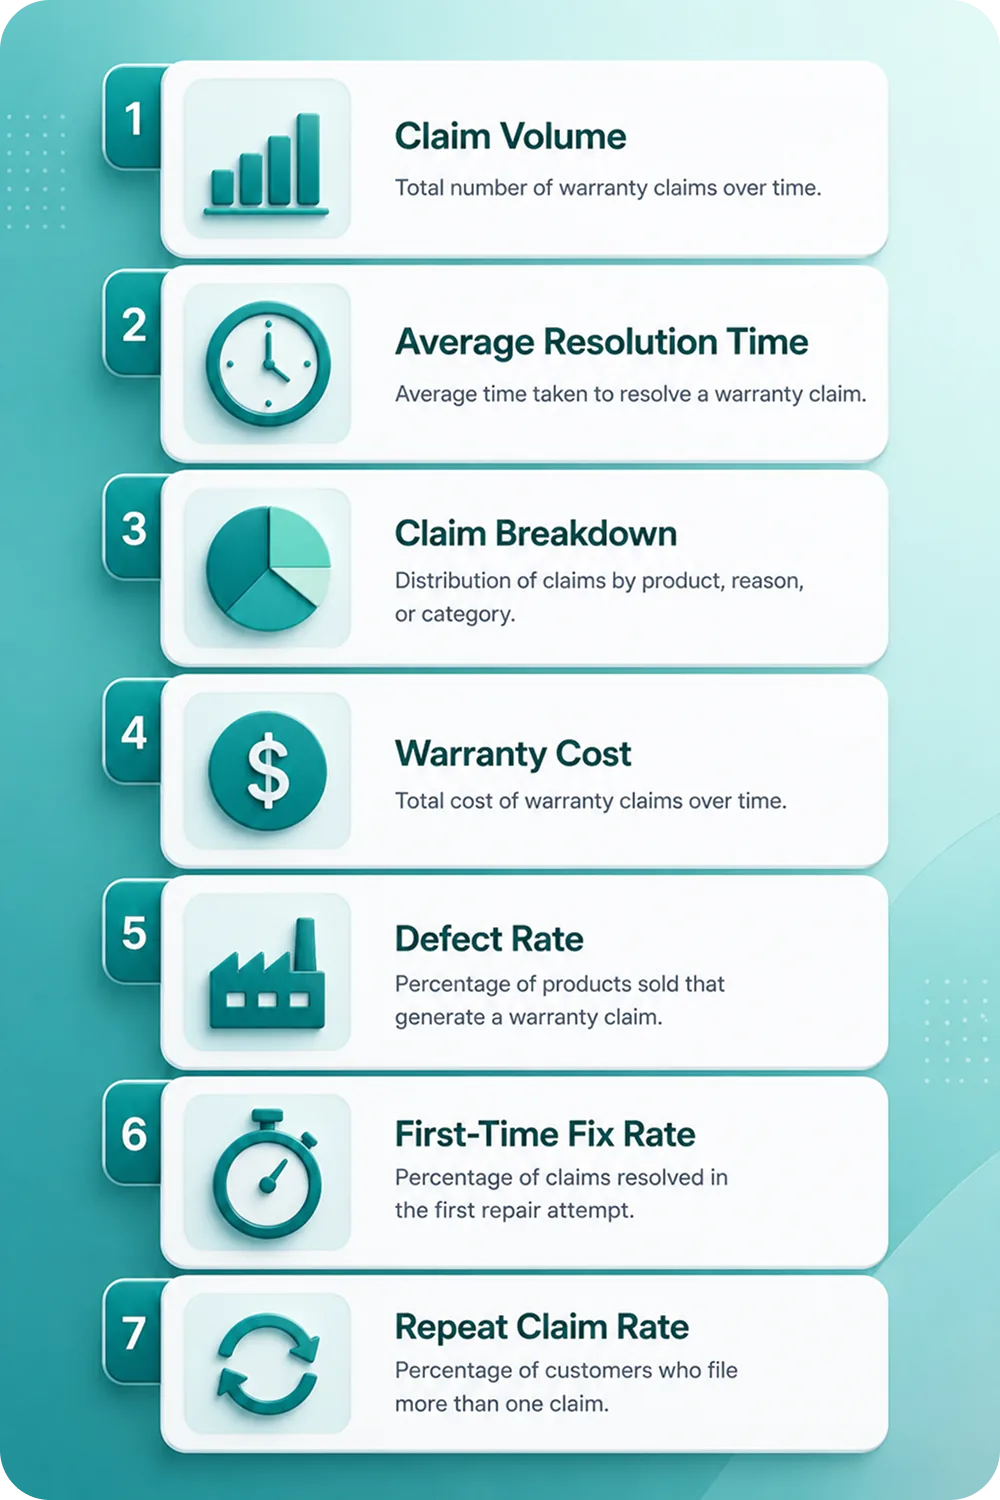
Key Metrics to Track in Warranty Analytics
Not all warranty data is equally useful. The metrics below give product and operations teams the clearest signal on where quality problems exist and how expensive they are.
Claim Rate per SKU
The percentage of units sold that generate a warranty claim. A SKU with a 0.5% claim rate is performing well. A SKU at 5% is bleeding money. Tracking this over time shows whether quality is improving or degrading.
Mean Time to Failure (MTTF)
How long a product lasts before the first claim. If a backpack averages 14 months before a strap breaks, but the warranty period is 24 months, there is a design or material issue that needs attention.
Defect Type Distribution
Categorizing claims by defect type (material failure, cosmetic damage, functional defect, missing parts) helps teams focus on the root cause, not just the symptom. If 60% of claims for a product line are material failures, the conversation shifts to the supplier, not the assembly line.
Cost per Claim
The fully loaded cost of resolving a claim: replacement product, shipping, labor, and any refund or credit. This metric helps prioritize which defects to fix first based on financial impact, not just volume.
Supplier Defect Rate
The claim rate broken down by supplier. If Supplier A's components generate three times more claims than Supplier B's, that is actionable intelligence for procurement negotiations and supplier quality scoring.
| Metric | What It Measures | Why It Matters | Benchmark |
|---|---|---|---|
| Claim Rate per SKU | % of units sold generating claims | Flags worst-performing products | Below 2% is healthy |
| Mean Time to Failure | Average lifespan before first claim | Reveals premature failures | Should exceed 75% of warranty period |
| Defect Type Distribution | Breakdown by failure category | Pinpoints root cause areas | No single type above 50% |
| Cost per Claim | Fully loaded resolution cost | Prioritizes fixes by financial impact | Varies by category |
| Supplier Defect Rate | Claim rate by supplier | Holds suppliers accountable | Below category average |
| Resolution Time | Days from claim to close | Measures operational efficiency | Under 5 business days |
| Repeat Claim Rate | % of customers filing second claim | Indicates incomplete resolution | Below 5% |
How Warranty Claims Data Reveals Manufacturing Defects
A single claim is noise. A hundred claims about the same issue is a signal. Warranty analytics surfaces these signals by aggregating claims across multiple dimensions.
Pattern Detection by Product Line
When a product line sees a sudden spike in claims, analytics helps answer whether the spike is tied to a specific batch, a new supplier, a design change, or a seasonal usage pattern. For example, a furniture brand might see claims for cracked tabletops peak every winter because temperature fluctuations affect the wood. That is not a defect. It is a usage condition that product descriptions should address.
Root Cause Categorization
Structured claim intake (where customers provide photos, descriptions, and product details at the time of submission) makes root cause analysis far more reliable. Platforms like Claimlane's self-service portal require customers to upload images and select defect categories, which feeds directly into analytics dashboards.
This structured data eliminates the guesswork that comes with parsing free-text emails. Instead of reading through hundreds of support tickets, product teams can filter claims by defect type, product line, and time period to spot trends immediately.
Connecting Defects to Production Batches
The most powerful application of warranty analytics is tracing defects back to specific production batches. When a brand can say, "Batch #4421 from Supplier X has a 12% claim rate versus the 2% average," they can take immediate action: quarantine remaining inventory, negotiate a credit note, and adjust future orders. This is where defect severity grading and CAPA processes become essential.
Using Warranty Analytics to Improve Supplier Quality
Supplier relationships often run on trust and anecdote. Warranty analytics introduces objectivity.
Building Supplier Scorecards
By tracking claim rates, defect types, and resolution costs per supplier, brands can build data-driven scorecards that inform procurement decisions. A supplier with consistently low defect rates earns more volume. A supplier with rising claim rates gets flagged for review.
This approach is especially powerful for multi-brand retailers that source from dozens of suppliers. Without analytics, it is nearly impossible to compare supplier quality across a portfolio of thousands of SKUs. With it, the comparison is automatic. For a detailed framework, read this guide on supplier quality issue reporting.
Forwarding Claims Data to Suppliers
The fastest way to improve supplier quality is to share the data. When suppliers see exactly which products are failing, how they are failing, and what the financial impact is, the conversation shifts from opinion to evidence.
Claimlane's forward-to-supplier feature lets brands route claims directly to the responsible supplier with all supporting evidence (photos, customer descriptions, serial numbers) attached. The supplier resolves the claim in the same system, which closes the loop and keeps all data in one place.
"With the integration to Business Central, resolving a claim in Claimlane automatically triggers all the necessary processes in our ERP. This means the customer service agent's work is complete the moment the claim is resolved in Claimlane."
— Kasper Andersen, IT Director, Konges Sløjd
Negotiating Supplier Credit Notes
Warranty analytics also strengthens cost recovery. When a brand can quantify the total cost of claims attributable to a specific supplier's components, the negotiation for credit notes or supplier chargebacks is grounded in data rather than estimates.
AI and Machine Learning in Warranty Analytics
Traditional warranty analytics relies on dashboards and manual queries. AI takes it further by automating pattern detection, predicting future failures, and recommending actions.
Automated Defect Classification
AI models trained on historical claims data can automatically classify new claims by defect type, severity, and likely root cause. This speeds up triage and ensures consistent categorization even when different agents handle claims differently.
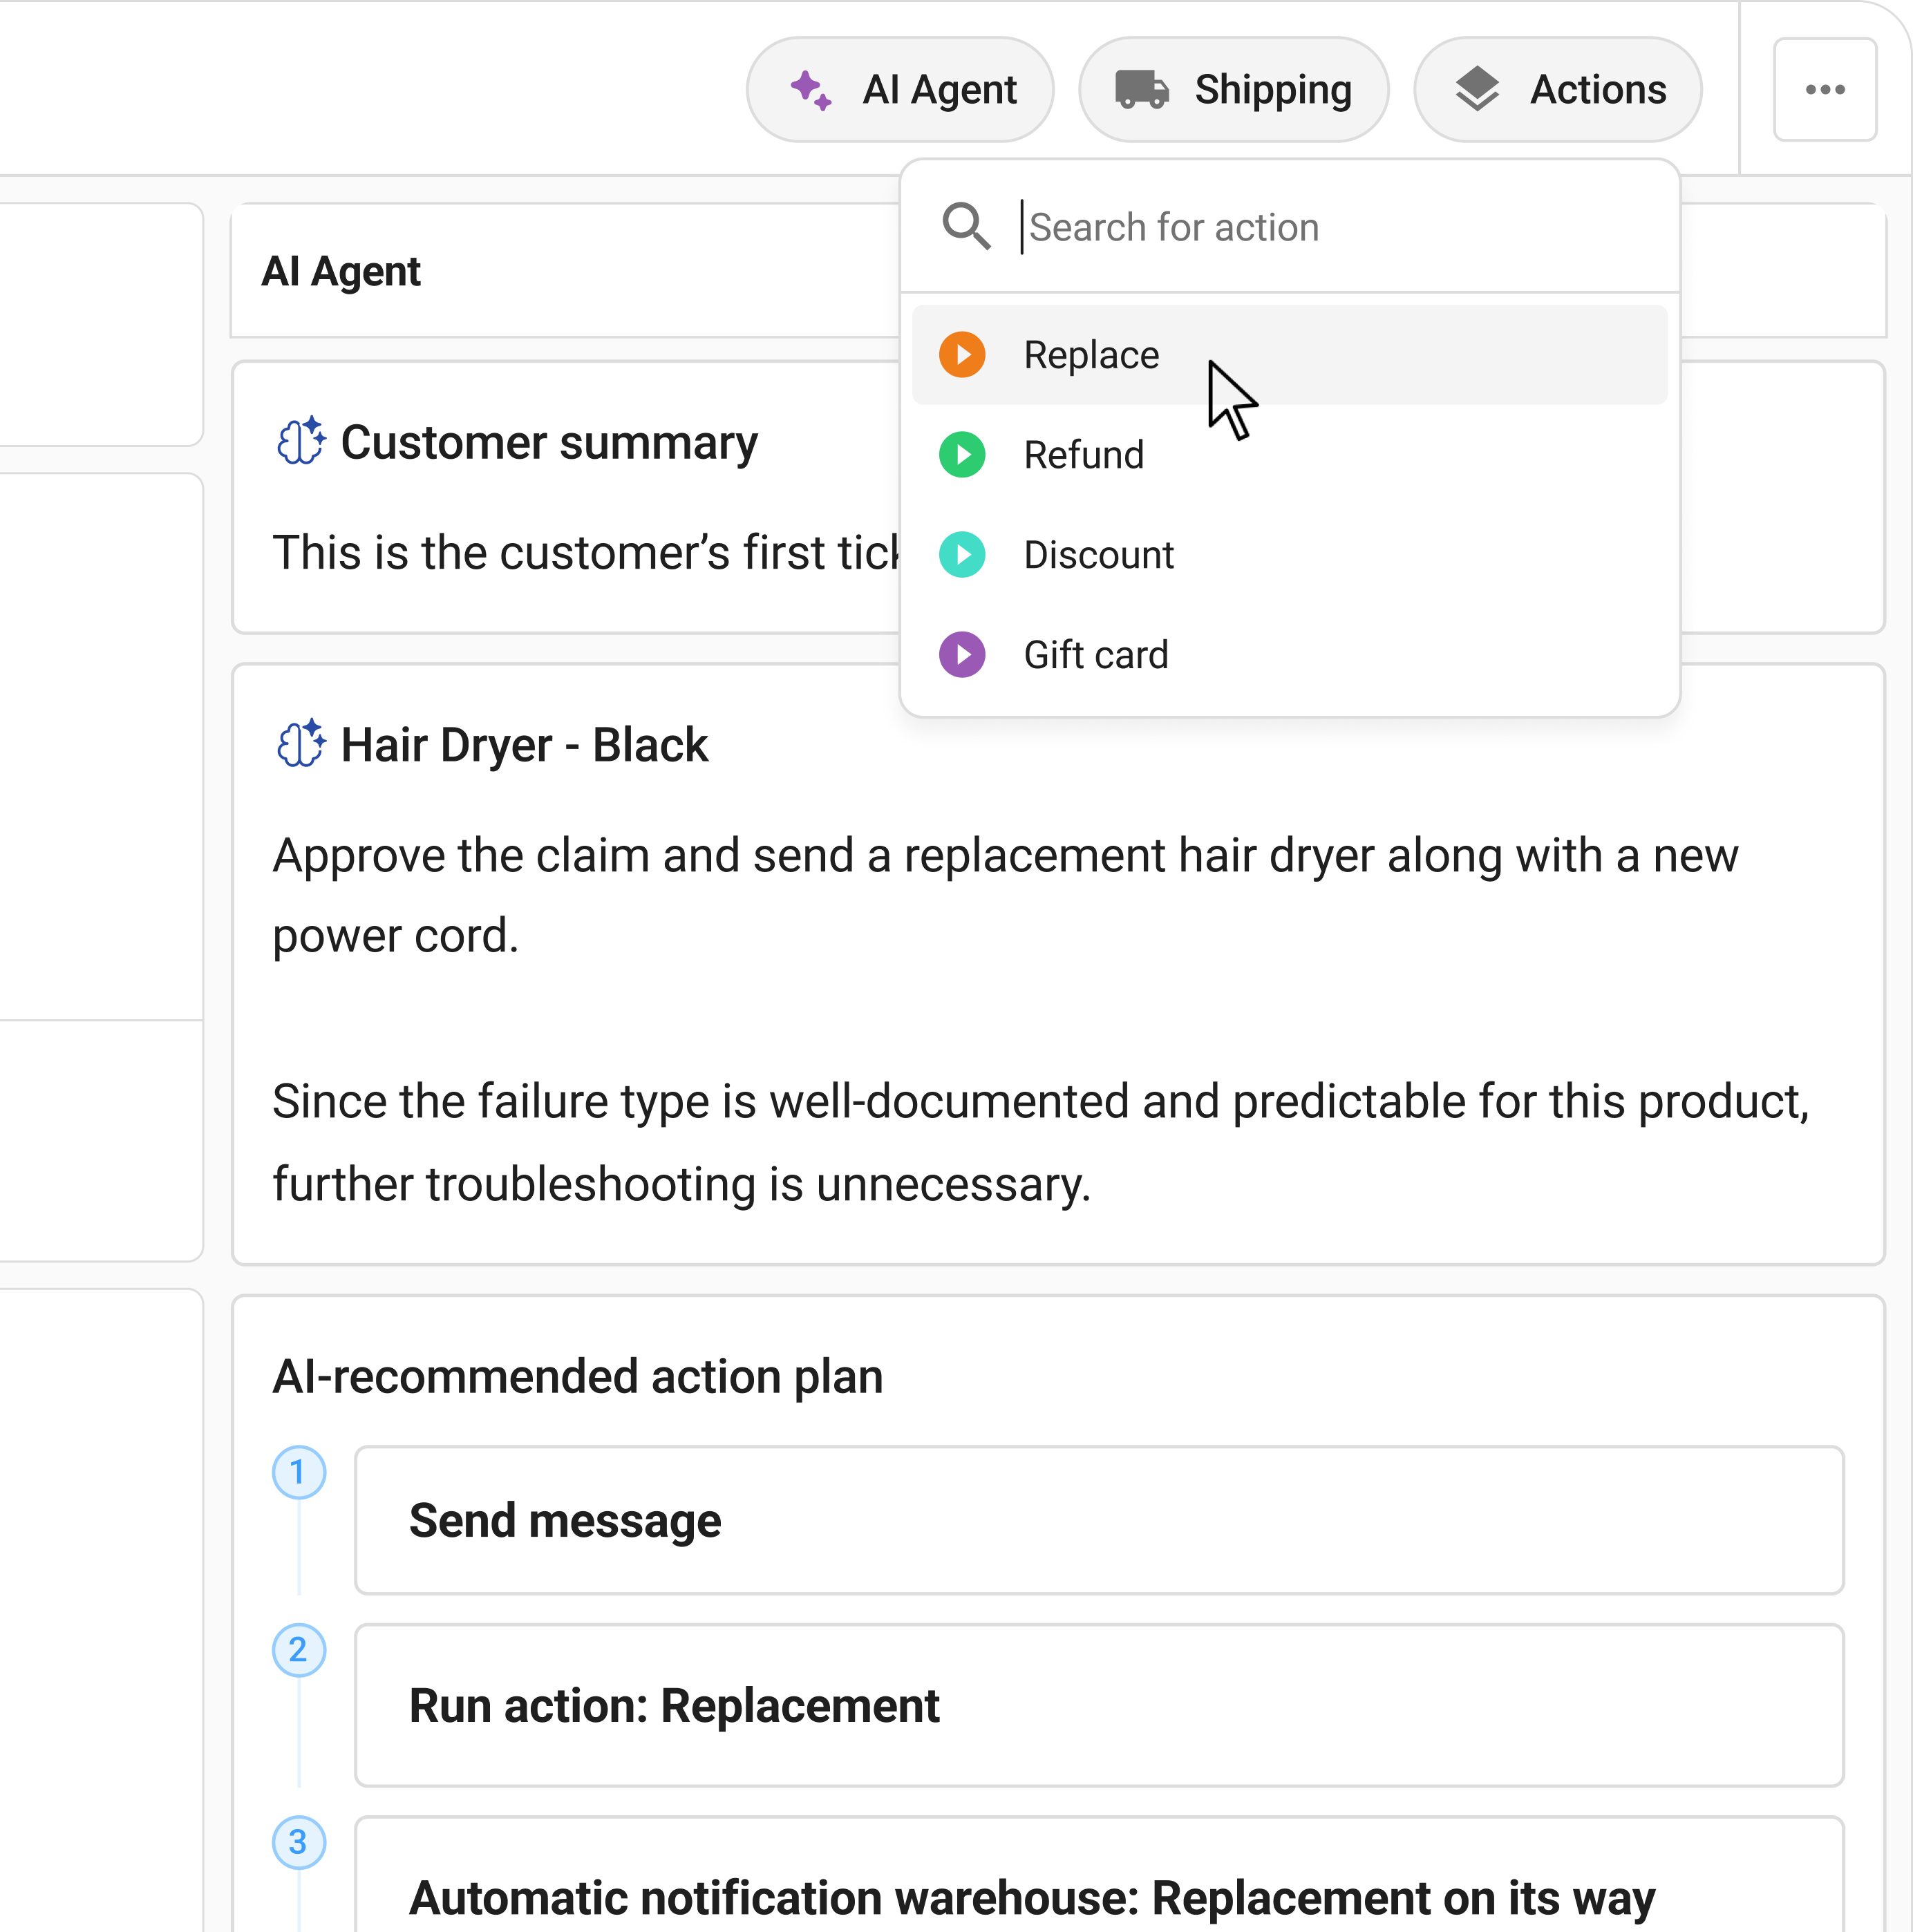
Claimlane's AI Agent, the first AI agent purpose-built for warranty claims and returns, analyzes product images and videos submitted with claims, applies warranty rules per product and supplier, and recommends or auto-approves resolutions. Every image that comes through the claims portal becomes a data point that improves the model over time.
Predictive Failure Modeling
By analyzing historical warranty data alongside product attributes (materials, supplier, manufacturing date, price point), machine learning models can predict which products are likely to generate claims before the failures happen. This allows brands to issue proactive recalls, adjust marketing, or redesign components. For a deeper dive into predictive approaches, see this guide on predictive warranty analytics.
Anomaly Detection
AI excels at spotting sudden changes in claim patterns. If a product that normally generates 10 claims per month suddenly hits 50, an anomaly detection system flags it immediately so teams can investigate before the problem scales.
Building a Warranty Analytics Dashboard
A warranty analytics dashboard should answer three questions at a glance:
- What is breaking? Top defect types by volume and cost.
- Where is it coming from? Claim rates by supplier, product line, and region.
- Is it getting better or worse? Trend lines over time.
Essential Dashboard Views
- Overview: Total claims, total cost, average resolution time, claim rate trend
- Product drilldown: Claim rate, defect distribution, and MTTF per SKU
- Supplier drilldown: Defect rate, cost per claim, and outstanding credit notes per supplier
- Time series: Weekly or monthly claim volume by product line
Claimlane's analytics module provides these views out of the box, with filters for date range, product category, claim status, and supplier. Brands using spreadsheets or generic BI tools typically spend weeks building equivalent reports manually.
Common Warranty Analytics Mistakes to Avoid
Tracking Volume Without Context
A product with 500 claims sounds alarming. But if that product sold 100,000 units (0.5% claim rate), it is actually performing well. Always normalize claim counts by units sold.
Ignoring Resolution Cost
Two products might have the same claim rate, but if one costs three dollars to resolve (ship a replacement part) and the other costs eighty dollars (full product replacement plus return shipping), the priority is obvious. Cost per claim must sit alongside volume metrics.
Siloed Data
Warranty data that lives in customer service software, disconnected from product data in the ERP and supplier data in procurement, is nearly useless for quality improvement. Integration is not optional. For more on this challenge, read about breaking down retail returns data silos.
Waiting Too Long to Act
Warranty data loses value over time. A defect pattern spotted three months after it started has already generated hundreds of unnecessary claims. Real-time or near-real-time analytics and automated alerts make the difference.
How Leading Brands Use Warranty Analytics
Brands that treat warranty claims as a data source rather than a cost center consistently outperform on product quality.
Case Study: Konges Sloejd
The Danish children's brand uses Claimlane to centralize claims from retailers and end consumers. By integrating claims data with their Business Central ERP, they can trace defects to specific production runs and share structured feedback with suppliers. The result: faster claim resolution, better data quality, and actionable insights for the product team. Read the full case study.
"By streamlining and automating our support workflows in Claimlane, we not only accelerated our customer service response times but also enhanced the overall system experience, internally and externally."
— Mikael Houlst Stausholm, Sales Director, Konges Sløjd
Case Study: Black Diamond
The outdoor equipment brand manages warranty claims and repairs across a wide product range. Using Claimlane, they organized complex repair workflows and gained visibility into which product categories generate the most claims. That data now feeds directly into product development decisions. Read the full case study.
Warranty Analytics and the Product Development Feedback Loop
The highest-value application of warranty analytics is not reducing claim costs (though that matters). It is improving the product itself.
When product teams receive structured defect data from warranty claims, they can:
- Redesign components that fail most often
- Switch to more durable materials based on real-world performance data
- Update specifications for suppliers based on failure patterns
- Validate that design changes actually reduced claim rates in subsequent production runs
This feedback loop turns warranty from a reactive cost center into a proactive quality improvement engine. Brands that run this loop consistently report lower claim rates, higher customer satisfaction scores, and stronger supplier relationships.
The key is getting the data out of customer service silos and into the hands of people who can change the product. Claimlane's integrations with ERPs, helpdesks, and ecommerce platforms make this data flow automatic.
Integrating Warranty Analytics with Your Tech Stack
Warranty analytics is only as good as the data flowing into it. For most ecommerce brands, that means connecting:
- Ecommerce platform (Shopify, WooCommerce, Magento): order data, product catalog, customer records
- ERP (Business Central, NetSuite, SAP): supplier data, inventory, financial records
- Helpdesk (Zendesk, Gorgias, Freshdesk): existing support tickets related to product issues
- Claims management platform (Claimlane): structured claims data with photos, defect categories, and resolution outcomes
Claimlane connects to 75+ platforms to unify this data. The integration ensures that when a claim is resolved in Claimlane, the corresponding credit note, replacement order, or repair record is automatically reflected in the ERP.
Warranty Analytics ROI: Measuring the Business Impact
The ROI of warranty analytics comes from three areas:
Reduced Claim Volume
Fixing the root cause of defects reduces future claims. A 20% reduction in claims for a high-volume product line can save tens of thousands in resolution costs annually.
Supplier Cost Recovery
Data-backed supplier management means more successful credit note negotiations. Brands using Claimlane's supplier forwarding feature recover costs that would otherwise be absorbed as losses.
Product Quality Improvements
Better products mean fewer claims, fewer returns, higher customer lifetime value, and stronger brand reputation. These second-order effects compound over time.
Claimlane is rated 4.8/5 on G2, reflecting how brands value the combination of claims automation and analytics in one platform.
Getting Started with Warranty Analytics
Brands that want to move from reactive claims handling to proactive quality improvement can follow this sequence:
- Centralize claims data. Move from spreadsheets and email to a structured claims management platform that captures defect type, product details, photos, and resolution outcome.
- Define key metrics. Start with claim rate per SKU, cost per claim, and supplier defect rate. Add more as the data matures.
- Build reporting cadences. Weekly reviews for the customer service team. Monthly reviews for product and procurement.
- Close the feedback loop. Share analytics with suppliers and product teams. Track whether changes reduce claim rates.
- Add AI. Once the data is clean and structured, layer on automated classification, anomaly detection, and predictive models.
Claimlane's analytics dashboard and workflow automation handle steps one through four out of the box. The AI Agent handles step five.
.webp)