
.webp)
Every returned product carries defect data that most retailers never use. The reason is simple: returns data lives in one system, quality assurance findings sit in another, and warranty claims get tracked somewhere else entirely. These retail returns defect data silos cost mid-sized retailers millions in repeated defects, slow supplier responses, and preventable warranty claims.
This guide explains why return defect data stays siloed, what that fragmentation actually costs, and how to connect returns, QA, and warranty workflows so product defect data from returns turns into measurable quality improvements.
TL;DR
- Returns, QA, and warranty data typically live in separate systems, creating silos that prevent cross-functional quality analysis.
- Unified defect data reduces repeat return rates by 15–25% within 12 months and cuts warranty claim costs by 30–40%.
- Breaking silos requires a shared defect taxonomy, mapped identifiers, and system integrations or a unified platform.
- Claimlane eliminates these silos by consolidating returns, warranty claims, and supplier forwarding into one system with built-in cross-functional analytics.
What Are Retail Returns Data Silos?
Defining the Problem
A data silo forms when one department or system stores information that other teams cannot easily access. In retail returns, silos appear when:
- The returns management system logs return reasons and customer complaints but does not share that data with the QA team.
- The quality assurance team tracks inspection results in spreadsheets or a standalone QMS that nobody outside the QA department can query.
- The warranty claims system processes claims, issues refunds or replacements, and records resolution data, but none of that feeds back into product development or supplier scorecards.
Each system captures valuable product defect data from returns. None of them talk to each other.
Why Silos Form in the First Place
Silos rarely appear on purpose. They grow from:
- Different teams buying different tools. Returns ops picks a returns platform. QA picks an inspection tool. Warranty picks a claims system. Each purchase makes sense in isolation.
- Lack of shared identifiers. Without a common product ID, SKU hierarchy, or defect taxonomy, merging data across systems requires manual mapping.
- Org chart boundaries. Returns reports to customer service. QA reports to operations. Warranty reports to finance. Nobody owns the cross-functional view.
- Legacy integrations. Older ERP and CRM systems were not built to pass granular defect-level data between modules.
The Real Cost of Siloed Returns Defect Data
Repeated Defects That Never Get Flagged
When return reason codes stay locked inside the returns platform, the product team never sees that 14% of a specific SKU comes back for the same zipper failure. The defect persists across production runs because nobody connects the return spike to a supplier quality issue.
Slow Supplier Responses
Supplier scorecards built without returns data only reflect inspection-stage findings. That misses the defects customers discover after weeks of use. Without a quality feedback loop from returns, suppliers lack the urgency and evidence to act on corrective actions.
Warranty Claim Inflation
If QA data does not flow into the warranty system, claims agents cannot distinguish between a known batch defect (which should trigger a proactive recall) and a one-off damage claim. The result: higher claim volumes, slower resolution, and more cost per claim.
According to a 2024 Deloitte report on retail operations, retailers that unify post-purchase data see 15-25% reductions in repeat defect rates within the first year.
Where Retail Returns Defect Data Gets Stuck

The Returns Platform
Most returns management systems capture return reason codes, customer comments, and sometimes photos. But these platforms are optimized for logistics: generating shipping labels, issuing refunds, updating inventory. Defect-level detail (which component failed, was it a manufacturing or shipping issue, does it match a known pattern) rarely gets structured or exported.
The QA/Inspection System
Quality teams run incoming inspections at the warehouse or distribution center. They log pass/fail rates, defect categories, and batch numbers. This data sits in a quality management system (QMS) or, more commonly, in Excel. It almost never merges with post-sale return data because the systems use different product identifiers and defect taxonomies.
The Warranty Claims System
Warranty platforms track claim submissions, proof-of-purchase validation, resolution type (refund, replacement, repair), and cost. They hold a goldmine of product failure data, but that data is structured around claim workflows, not product quality analysis. Most warranty management platforms were not designed to feed defect trends back to product or sourcing teams.
The ERP Black Hole
ERP systems like NetSuite, SAP, or Dynamics 365 often serve as the system of record for inventory and financials. Returns show up as inventory adjustments and credit memos. The defect context (why was it returned, what broke, which supplier batch) gets stripped out during data entry because ERP return modules were not built for that granularity.
How Cross-Functional Data Sharing in Retail Works
Step 1: Standardize Defect Taxonomy
Before connecting any systems, every team needs to classify defects the same way. Create a shared defect taxonomy with three levels:
- Category: Manufacturing, Shipping, Design, Material
- Subcategory: Stitching failure, Color mismatch, Broken component, Packaging damage
- Severity: Critical (safety risk), Major (product unusable), Minor (cosmetic)
This taxonomy must be used consistently across returns reason codes, QA inspection forms, and warranty claim categories.
Step 2: Map System Identifiers
Connect product identifiers across systems. At minimum, every system should share:
- SKU or product ID
- Supplier ID
- Batch or lot number (when available)
- Order ID (to link a return to its original purchase)
Without this mapping, joining data across returns, QA, and warranty is manual and error-prone.
Step 3: Build the Integration Layer
Returns data integration can take multiple forms depending on tech maturity:
- API-based real-time sync. Returns platform pushes defect data to a central warehouse or directly to the QMS. Best for high-volume retailers.
- Scheduled batch exports. Nightly CSV or database dumps from each system into a shared data lake. Simpler to set up, but delayed.
- Unified platform. A single system that handles returns, warranty claims, and supplier communication. Eliminates the integration problem entirely by keeping all defect data in one place.
Platforms like Claimlane take the unified approach: returns, warranty claims, and supplier forwarding all live in one system, so defect data never has to cross a system boundary.
Step 4: Create Shared Dashboards
Once data flows between systems, build dashboards that multiple teams can access. Key views:
- Product quality scorecard: Defect rate by SKU, supplier, and time period. Combines return reasons + QA findings + warranty claims.
- Supplier performance dashboard: Links return volumes and warranty claim costs to specific suppliers. Feeds directly into supplier quality scoring.
- Trending defects alert: Flags SKUs with rising return rates before they become a warranty claim spike.
Building a Quality Feedback Loop From Returns
The most valuable outcome of breaking down retail returns defect data silos is the feedback loop: return data flows into quality analysis, quality analysis triggers supplier actions, and supplier improvements reduce future returns.
From Return to Root Cause
When a customer returns a product and selects "defective" as the reason, that data point should trigger a structured workflow:
- The return reason and any attached photos/videos get categorized using the shared defect taxonomy.
- The defect gets matched against existing QA findings for that SKU and supplier.
- If the defect matches a known pattern, it increments the count on an existing nonconformance report (NCR).
- If it is new, it opens a new NCR and routes it to the QA team for investigation.
This is exactly how Claimlane's workflow engine operates: every claim and return feeds structured defect data into a single system that teams across the organization can act on.
From Root Cause to Supplier Action
Once defect patterns are identified, the next step is forwarding structured evidence to suppliers. A good supplier communication workflow includes:
- Defect documentation: Photos, videos, and structured descriptions from the customer's return submission.
- Volume data: How many units affected, return rate trends, warranty claim costs.
- Corrective action request: Specific ask for the supplier, with a deadline.
Platforms that forward claims directly to suppliers eliminate the back-and-forth email chains that slow down corrective actions. The supplier sees the evidence, the volume, and the urgency in one place.
Claimlane helps us capture every customer issue, resolve it for the customer, and feed that back to the supply chain to drive continuous improvement.
Henry Currer, Head of Operations — Swoon Furniture
From Supplier Action to Measurable Improvement
The loop closes when supplier corrective actions lead to measurable reductions in returns and warranty claims for that SKU. Track:
- Return rate for the affected SKU before and after the corrective action.
- Warranty claim volume for the same SKU.
- Time-to-resolution for the supplier's corrective action.
Returns analytics should show a clear downward trend after a successful corrective action. If the trend does not improve, escalate to a second-round corrective action or consider changing suppliers.
Return Quality Issue Analysis: What to Measure
Defect Rate by SKU
The percentage of units sold that come back as defective. This is the baseline metric for product quality. Split it by:
- Product category
- Supplier
- Production batch
- Sales channel (online vs. in-store)
Defect Clustering
Are returns for a specific SKU concentrated around one defect type, or spread across multiple failure modes? Clustering indicates a systematic issue (bad supplier batch, design flaw). Dispersion suggests random quality variation.
Time-to-Defect Discovery
How long after purchase does the customer report the defect? Short intervals (under 30 days) suggest manufacturing issues. Longer intervals (3-6 months) point to durability or material problems. This metric determines whether the defect should be addressed through QA inspection improvements or warranty coverage adjustments.
Warranty Claim Correlation
What percentage of returned defective products also generate a warranty claim? If the number is high, returns and warranty workflows should be unified so agents do not process the same defect twice.
Cost Per Defect
Total cost of a defect occurrence: return shipping, inspection labor, refund or replacement value, warranty processing cost, and customer acquisition cost to replace the lost customer. This number justifies investment in data integration.
Reverse Logistics Insights That Silos Hide
Reverse logistics generates data at every touchpoint: return authorization, shipping, receiving, inspection, disposition. When that data stays in the logistics system, several insights get lost.
Disposition Patterns
What happens to returned products? The breakdown between resell-as-new, refurbish, liquidate, and scrap tells a story about product quality that QA teams need. A high scrap rate for a specific SKU signals a severe quality problem. A high refurbish rate suggests fixable defects that the supplier should prevent at source.
Reverse logistics data becomes much more powerful when combined with upstream return reasons and downstream warranty outcomes.
Geographic Defect Patterns
Returns from specific regions or fulfillment centers may cluster around shipping damage rather than manufacturing defects. Without cross-referencing return data with logistics data, the product team might blame the supplier for a packaging or transit problem.
Seasonal and Batch Correlation
Returns data can reveal quality differences between production batches or seasonal runs. If a specific batch shipped in Q3 shows 3x the return rate of the Q2 batch, that is a supplier conversation. But only if the returns platform passes batch-level data to the QA and supplier management system.
How AI Accelerates Cross-Functional Data Sharing in Retail
Artificial intelligence plays a growing role in connecting siloed defect data. Here is where it adds the most value.
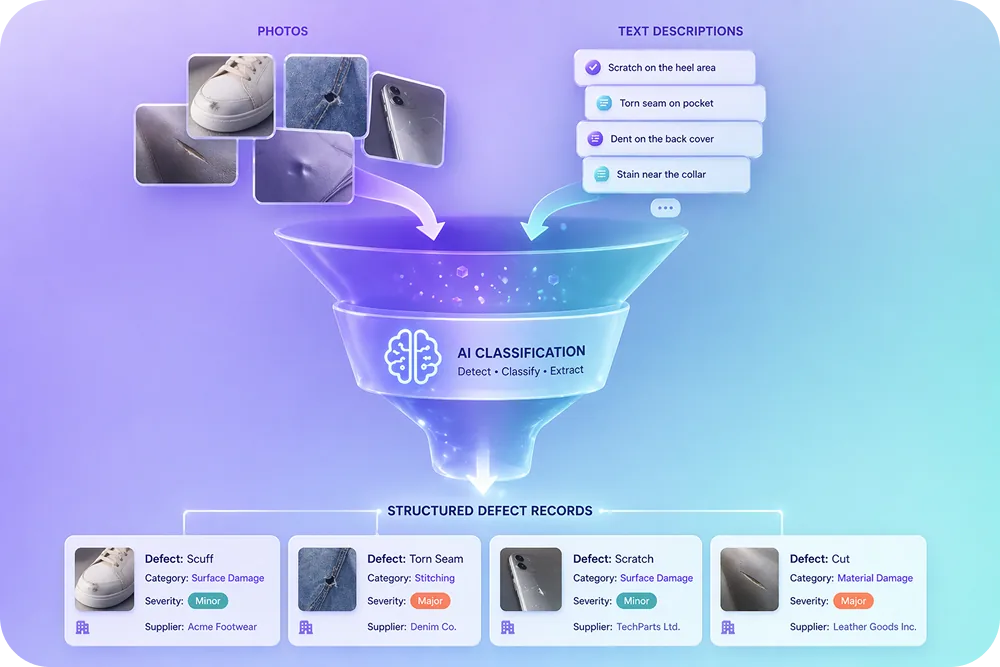
Automated Defect Classification
AI models can analyze return photos and customer descriptions to auto-classify defects into the shared taxonomy. This removes the manual tagging bottleneck that slows down return quality issue analysis. Claimlane's AI Agent, the first AI agent purpose-built for warranty claims and returns, analyzes product images and videos, applies warranty rules per product and supplier, and recommends or auto-approves resolutions.
Pattern Detection Across Systems
Machine learning algorithms can spot defect patterns that span multiple data sources, even when those sources use slightly different defect codes. An AI model trained on combined returns + QA + warranty data can surface correlations that no single team would catch manually.
Predictive Defect Alerts
Once a model has enough historical data, it can predict which SKUs are likely to see a return spike based on early signals: initial return velocity, customer complaint sentiment, inspection findings. Predictive returns analytics gives product and sourcing teams a head start on corrective actions before the problem scales.
Returns Data Integration: Architecture Options
Option 1: Point-to-Point Integrations
Connect each system directly. Returns platform pushes data to QMS via API. QMS pushes findings to the warranty system. The warranty system sends claim data back.
Pros: Fast to set up for 2-3 systems.
Cons: Breaks down at scale. Every new system adds N-1 new integrations. Hard to maintain.
Option 2: Data Warehouse or Lake
All systems dump data into a central warehouse (Snowflake, BigQuery, Redshift). Analysts build cross-functional views using SQL.
Pros: Flexible querying, supports complex analysis.
Cons: Delayed insights (batch processing), requires data engineering resources, does not enable real-time action.
Option 3: Unified Returns and Claims Platform
Use a single platform that handles returns, warranty claims, and supplier communication natively. No integration needed because all data lives in one system from the start.
Pros: Real-time cross-functional visibility, no data mapping issues, actionable workflows built in.
Cons: Requires migrating off existing returns and warranty tools.
For mid-sized retailers, Option 3 offers the fastest path to breaking down retail returns defect data silos. Platforms like Claimlane combine returns processing, warranty claim management, and supplier forwarding with built-in analytics that connect all three data streams.
With Claimlane, we've transformed our returns process into an automated system. We can now efficiently track the status of all returns and claims, and our teams collaborate more effectively than ever before. The solution helps us share information both internally and externally, which has been key to our success.
Simone Andersen, Customer Care Manager — Coolshop
Case Study: Connecting Returns and Supplier Quality
Consider a mid-sized outdoor gear brand selling across 200+ retail partners. Before unifying their data:
- Return reason codes were stored in Shopify. QA inspection data lived in Excel. Warranty claims were handled via email threads.
- The brand processed the same defect three times: once as a return, once as a QA flag, once as a warranty claim. Each time, a different team handled it in isolation.
- Suppliers received vague emails about "quality issues" with no supporting data.
After moving to a unified returns and claims platform:
- Every return and warranty claim fed into a single defect database, tagged with SKU, supplier, batch, and defect category.
- Suppliers received structured nonconformance reports with photos, volume data, and deadlines.
- Within two quarters, the brand's repeat defect rate dropped by 22%, and warranty claim processing costs fell by 35%.
Black Diamond followed a similar path, automating warranty claim and repair workflows to connect customer-reported defects directly to their quality and supplier management processes.
Common Mistakes When Breaking Down Silos
Mistake 1: Starting With Technology Before Process
Buying an integration tool before standardizing defect categories and data formats leads to garbage-in, garbage-out. Fix the taxonomy first.
Mistake 2: Building Dashboards Nobody Uses
Cross-functional dashboards only work if every team has a reason to check them. Tie dashboard metrics to team KPIs: QA gets measured on defect detection rate, sourcing gets measured on supplier corrective action turnaround, and returns ops gets measured on cost per return.
Mistake 3: Ignoring Customer-Submitted Evidence
Photos and videos that customers attach to returns and warranty claims are some of the richest defect data available. Many retailers discard or ignore them during processing. A self-service portal that collects structured evidence from customers at submission time turns every return into a quality data point.
Mistake 4: Treating Returns and Warranty as Separate Workflows
Many retailers run returns through one team and warranty claims through another, with completely separate systems. But the underlying defect is often the same. Unifying these workflows under one system, like Claimlane, eliminates duplicate processing and creates a single defect record per product issue.
Who Should Own Cross-Functional Defect Data?
The Case for a Dedicated Quality Insights Role
In most mid-sized retailers, nobody owns the cross-functional defect view. Returns ops owns the return. QA owns the inspection. Warranty owns the claim. The gap is someone who connects all three.
The most effective approach is to assign ownership to a quality insights analyst or a cross-functional quality team that:
- Defines and maintains the shared defect taxonomy.
- Builds and monitors cross-functional dashboards.
- Runs weekly defect review meetings with returns, QA, warranty, and sourcing stakeholders.
- Owns the supplier corrective action process end to end.
Smaller Teams Without a Dedicated Role
For teams too small to justify a dedicated role, the returns or operations manager can own the cross-functional view, provided they have access to a unified platform that consolidates the data automatically. Platforms with built-in analytics reduce the manual work of pulling data from multiple sources.
Building Your Returns Data Integration Roadmap
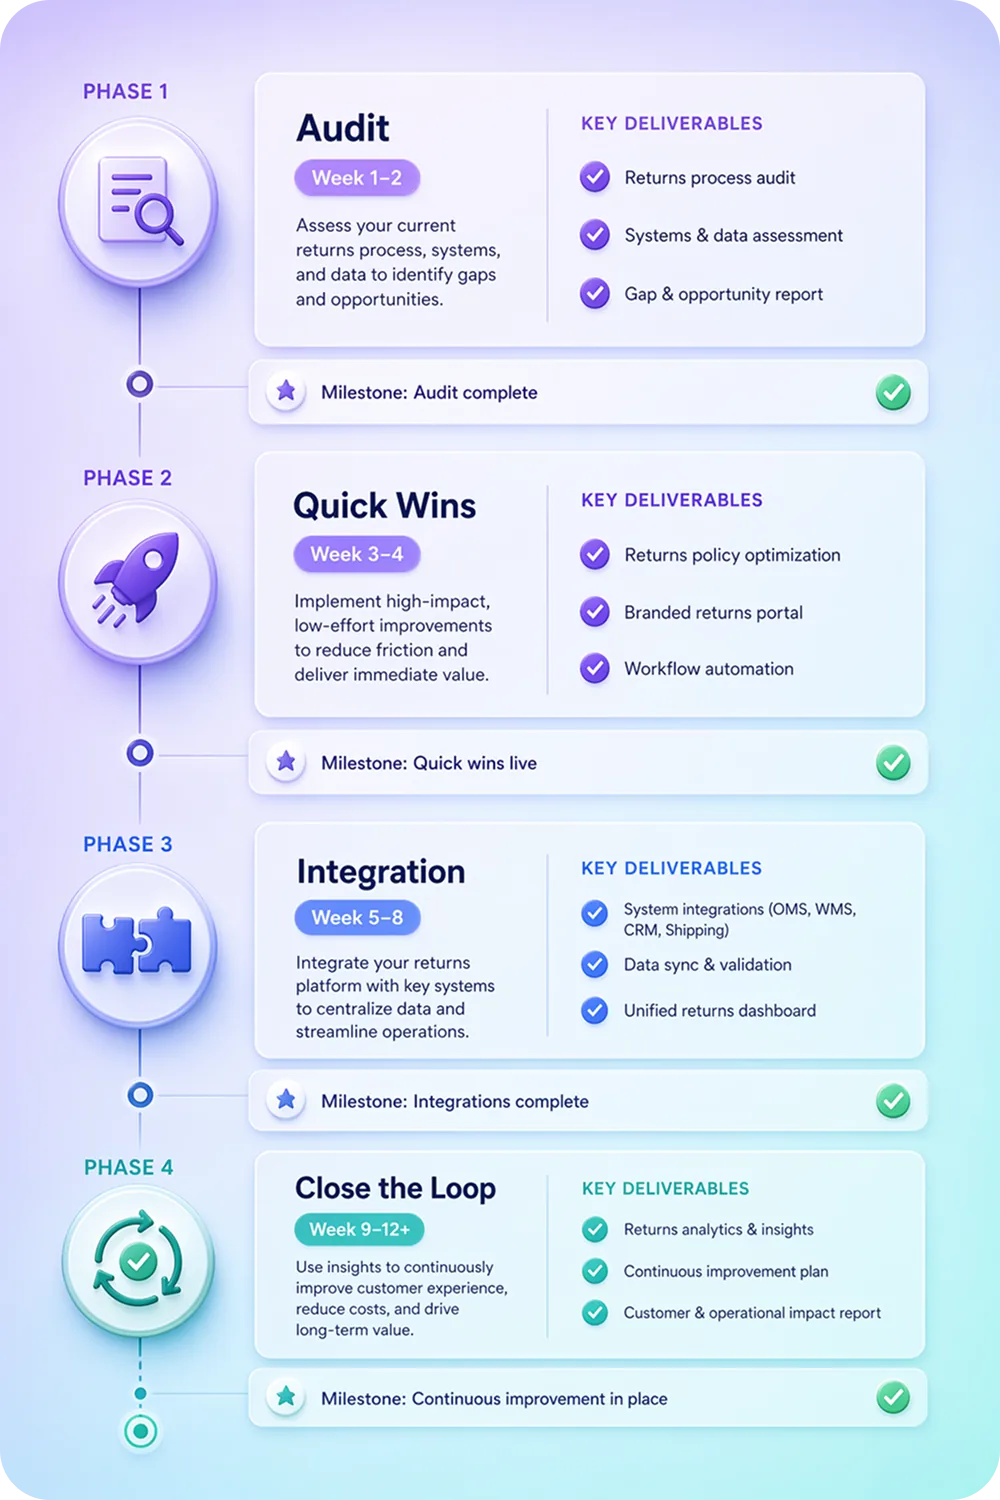
Phase 1: Audit and Standardize (Weeks 1-4)
- Map every system that touches return, warranty, or quality data.
- Document data fields, identifiers, and defect categories in each system.
- Create the shared defect taxonomy.
- Identify the biggest data gaps (e.g., no batch tracking in returns, no photos in QA).
Phase 2: Quick Wins (Weeks 5-8)
- Connect returns data to the QA team via a shared report or dashboard. Even a weekly CSV export is a start.
- Add batch/lot number tracking to the returns process.
- Start collecting structured defect evidence (photos, defect type) at the point of return.
Phase 3: System Integration (Weeks 9-16)
- Implement API integrations or migrate to a unified platform.
- Build cross-functional dashboards accessible to returns, QA, warranty, and sourcing.
- Set up automated alerts for trending defects.
Phase 4: Close the Loop (Ongoing)
- Launch automated supplier corrective action workflows triggered by defect thresholds.
- Track defect reduction metrics by SKU and supplier.
- Run quarterly reviews to refine the taxonomy and improve data quality.
Retailers already using a warranty registration system can jump to Phase 3 faster because they already have product-level tracking in place.
Industry Benchmarks: What Good Looks Like
According to the National Retail Federation and industry benchmarks:
- The average ecommerce return rate sits between 20-30%. Products with known defects drive a disproportionate share.
- Retailers with unified returns and quality data reduce their defective-return rate by 15-25% within 12 months.
- Supplier corrective action turnaround drops from 60-90 days to under 30 days when suppliers receive structured defect evidence from a single platform.
- Warranty claim processing costs drop 30-40% when claims agents can see the full defect history at the time of claim submission.
How Claimlane Breaks Down Returns Defect Data Silos
Claimlane is a warranty and returns management platform purpose-built to eliminate the data silos between returns, warranty claims, and supplier communication.
Unified Data Model
Every return, warranty claim, and repair request lives in one system. Defect data is tagged with product, supplier, batch, and category from the moment a customer submits it through the self-service portal.
Automated Supplier Forwarding
Forward claims to suppliers with full defect evidence attached. Suppliers see photos, defect categories, volume data, and corrective action deadlines in one view.
Built-In Analytics
Claimlane's analytics connect returns data, warranty data, and supplier performance into dashboards that every team can access. No data warehouse needed.
AI-Powered Defect Triage
Claimlane's AI Agent, the first AI agent purpose-built for warranty claims and returns, analyzes product images and customer descriptions to auto-classify defects and recommend resolutions. It applies warranty rules per product and supplier, speeding up triage and reducing manual classification work.
75+ Integrations
Claimlane integrates with Shopify, WooCommerce, ERP systems, Zendesk, and shipping providers, pulling in order data and pushing resolution updates back to the systems of record.
Claimlane is rated 4.8/5 on G2 (read reviews).
.webp)

