
.webp)
Product returns cost U.S. retailers roughly $890 billion in 2024, according to the National Retail Federation. That number keeps climbing. But what if brands could see returns coming before customers even printed their shipping labels? Predictive returns analytics makes that possible by using historical data, machine learning, and behavioral signals to forecast which orders are most likely to come back.
This isn't theoretical. Ecommerce brands are already using predictive analytics to flag high-risk orders, adjust product listings, and rethink their return policies before losses stack up.
TL;DR
- Predictive returns analytics uses ML to forecast which orders will be returned before they ship, shifting brands from reactive damage control to proactive prevention.
- Even a small reduction in return rate saves big. A 3-percentage-point drop can save $22,500–$45,000 per month in processing costs alone.
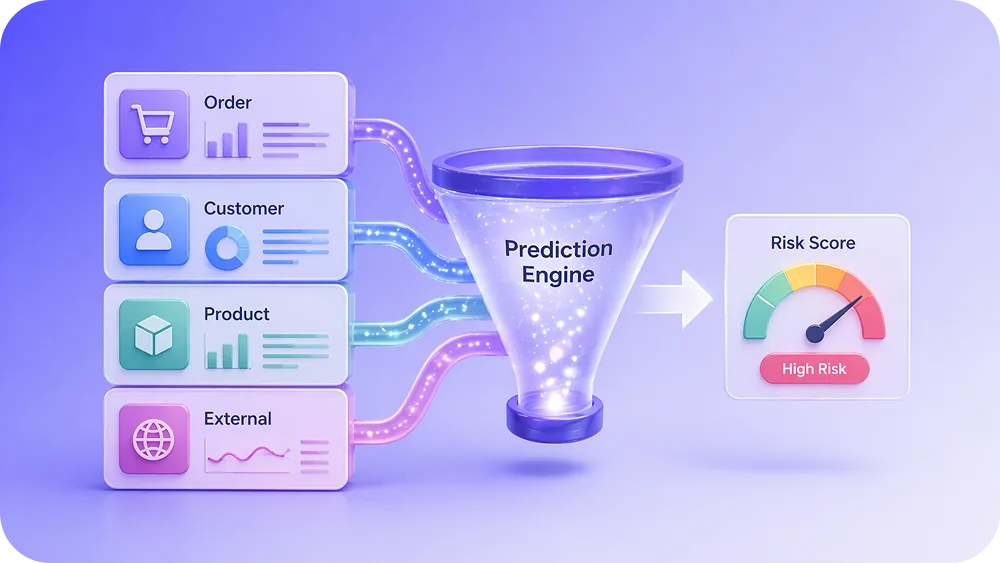
- Key data inputs include order history, customer behavior, product attributes, and seasonal signals fed into models that score every new order for return risk.
- Claimlane centralizes return and claims data across channels, and its AI Agent acts on predictions to auto-resolve low-risk returns and warranty claims.
What Is Predictive Returns Analytics?
Predictive returns analytics applies statistical models and machine learning algorithms to historical order, product, and customer data. The goal is to forecast which purchases have a high probability of being returned.
Unlike traditional returns analytics that look backward at what already happened, predictive models look forward. They identify patterns across thousands of variables and flag risks at the point of sale or even before.
Think of it as the difference between reading yesterday's weather report and checking a forecast for next week.
How It Differs from Descriptive Analytics
Descriptive analytics tells a brand that 22% of size L hoodies were returned last quarter. Predictive analytics tells the brand that a specific customer ordering two sizes of the same hoodie has a 74% chance of returning at least one.
One is a report. The other is an actionable signal.
Why Ecommerce Brands Need Return Prediction Models
Returns eat into margins from multiple directions: shipping costs, restocking labor, inventory depreciation, and lost resale value. The average ecommerce return rate in 2026 sits between 19% and 20.5% across all categories, roughly two to three times the brick-and-mortar rate.
Brands that rely only on reactive returns management are always playing catch-up. Predictive models shift the strategy from damage control to proactive optimization.
The Financial Case for Prediction
Consider a mid-size apparel brand processing 50,000 orders per month with a 25% return rate. If predictive analytics reduces that rate by even 3 percentage points, that's 1,500 fewer returns per month. At an average processing cost of $15 to $30 per return, the savings add up to $22,500 to $45,000 monthly.
That math gets even more compelling when factoring in recovered inventory value and improved returns-adjusted profitability.
What Data Feeds a Return Prediction Model?
Predictive models are only as good as the data behind them. Here are the core data inputs that drive accurate return forecasting.
Order-Level Data
- Order value and discount applied
- Number of items in the cart
- Multiple sizes or colors of the same product (bracketing signals)
- Shipping speed selected
- Payment method
Customer-Level Data
- Past return history and return rate
- Account age and purchase frequency
- Geographic location (return rates vary by region)
- Customer segment or loyalty tier
Product-Level Data
- Historical return rate by SKU
- Product category (apparel and footwear have the highest rates)
- Average review score and sentiment
- Size chart accuracy and fit feedback
- Product description completeness
External Signals
- Seasonality patterns (holiday returns spike in January)
- Promotional intensity (deep discounts attract impulse buys)
- Competitor pricing and availability
Brands using platforms like Claimlane's analytics dashboard can aggregate claim and return data across channels, giving predictive models a richer dataset to work with. Claimlane is rated 4.8/5 on G2 (read reviews), reflecting its strength in centralizing returns and warranty data for actionable insights.
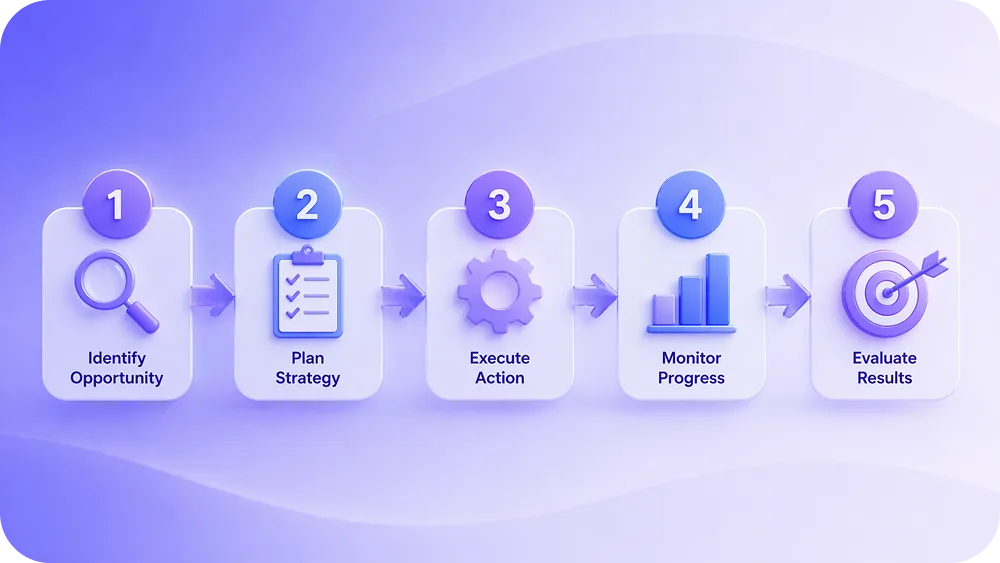
How Predictive Returns Analytics Works (Step by Step)
Building a return prediction model follows a structured process. Here's how it typically works.
Step 1: Data Collection and Cleaning
Pull historical order, return, and customer data from your ecommerce platform, returns management system, warehouse management system, and customer service tools. Clean the data by removing duplicates, filling gaps, and standardizing formats.
Step 2: Feature Engineering
Transform raw data into meaningful features. For example, instead of using raw order value, create features like "order value relative to customer average" or "number of items above median return rate." This is where domain expertise matters.
Step 3: Model Training
Train a machine learning model on historical data where you know the outcome (returned vs. kept). Common algorithms include gradient boosting (XGBoost, LightGBM), random forests, and logistic regression. More advanced approaches use deep learning for sequence modeling of customer behavior.
Step 4: Validation and Testing
Split data into training and test sets. Evaluate model performance using metrics like AUC-ROC, precision, recall, and F1 score. A good model balances catching high-risk orders (recall) without flagging too many false positives (precision).
Step 5: Deployment and Action
Integrate the model into your order pipeline. When a new order comes in, the model scores it in real time and triggers appropriate actions based on the risk level.
Practical Use Cases for Return Prediction
Predictive returns analytics isn't just a data science exercise. It drives real operational changes.
Pre-Purchase Interventions
If a customer's browsing pattern suggests bracketing (adding three sizes of the same item), the site can surface better size guidance, show fit reviews from similar body types, or highlight the brand's exchange policy to encourage getting it right the first time.
Dynamic Return Policies
High-risk orders might qualify for store credit only, while low-risk loyal customers get instant refunds. This personalized approach to return policies balances customer experience with cost control.
Inventory and Demand Planning
If a model predicts that 30% of a new product launch will be returned, the supply chain team can plan warehouse capacity, restocking workflows, and markdown strategies accordingly. This ties into broader ecommerce logistics planning.
Product Listing Optimization
When certain SKUs consistently show high predicted return rates, merchandising teams can investigate root causes. Maybe the product photos are misleading, the description lacks detail, or reviews mention a recurring defect. Fixing the listing reduces returns at the source.
Fraud Detection
Serial returners and return fraud patterns become visible through predictive scoring. Instead of applying blanket restrictions, brands can target enforcement where it matters.
AI Returns Forecasting vs. Traditional Approaches
Some brands still rely on spreadsheets and static rules to manage returns. Here's how AI-powered prediction compares.
With the integration to Business Central, resolving a claim in Claimlane automatically triggers all the necessary processes in our ERP. This means the customer service agent's work is complete the moment the claim is resolved in Claimlane.
Kasper Andersen, IT Director — Konges Sløjd
The Role of AI Agents in Predictive Returns
The next evolution of predictive analytics isn't just models running in the background. It's AI agents that act on predictions autonomously.
Claimlane's AI Agent, the first AI agent purpose-built for warranty claims and returns, represents this shift. It analyzes product images and videos, applies warranty rules per product and supplier, and recommends or auto-approves resolutions. When combined with predictive return scoring, these agents can route high-risk claims through additional verification while fast-tracking low-risk returns.
MaxGaming, the largest gaming and e-sports ecommerce in Scandinavia with over 30,000 SKUs, resolved complex RMA cases 77% faster using Claimlane's AI agents. The AI reviews images, checks business rules, and recommends actions so support agents no longer need months of product training.
Building a Predictive Analytics Stack for Returns
Brands don't need to build everything from scratch. Here's a practical stack.
Data Layer
- Ecommerce platform (Shopify, WooCommerce, Magento) for order data
- Returns management platform for return reason data, images, and resolution history
- Customer data platform for behavioral signals
Analytics Layer
- Data warehouse (BigQuery, Snowflake, or Redshift) for centralized storage
- Feature store for managing model inputs
- ML platform (SageMaker, Vertex AI, or open-source tools like MLflow)
Action Layer
- Real-time scoring API integrated into the checkout flow
- Workflow automation tools to trigger actions based on risk scores
- Dashboard for operations and merchandising teams
Integration Layer
Platforms like Claimlane offer 75+ integrations with Shopify, WooCommerce, ERP systems, Zendesk, and shipping providers. This integration layer is what makes prediction actionable instead of just interesting.
Predictive Analytics in the Supply Chain
Return prediction doesn't stop at the order level. It feeds directly into supply chain decisions.
When a brand knows that 25% of a seasonal collection will likely be returned, the supply chain team can plan accordingly:
- Reserve warehouse space for incoming returns
- Pre-schedule inspection and restocking labor
- Negotiate carrier rates for reverse logistics volume
- Identify which items can be resold, refurbished, or recycled
Mads Norgaard, a fashion brand, uses data-driven claims analysis to improve product quality and reduce defect rates. By feeding return reason data back to suppliers, they catch quality issues before they scale.
Common Pitfalls (and How to Avoid Them)
Predictive returns analytics isn't plug-and-play. Here are common mistakes.
Overfitting to Historical Patterns
A model trained exclusively on 2024 holiday data won't generalize to spring 2026. Use rolling training windows and regularly retrain models with fresh data.
Ignoring Product-Level Signals
Customer-level features get most of the attention, but product attributes often matter more. A poorly photographed product with a 40% return rate will drive returns regardless of who buys it.
Acting Too Aggressively on Predictions
Blocking high-risk orders or imposing strict return policies on predicted returners can backfire. Customers notice when they're treated differently, and the CX damage can outweigh the return savings. Start with soft interventions like better size guidance or proactive support.
Siloed Data
If return reason data lives in a spreadsheet while order data sits in Shopify and warranty claims are tracked in email threads, no model will perform well. Centralize data first.
Industry-Specific Applications
Return prediction plays out differently across verticals.
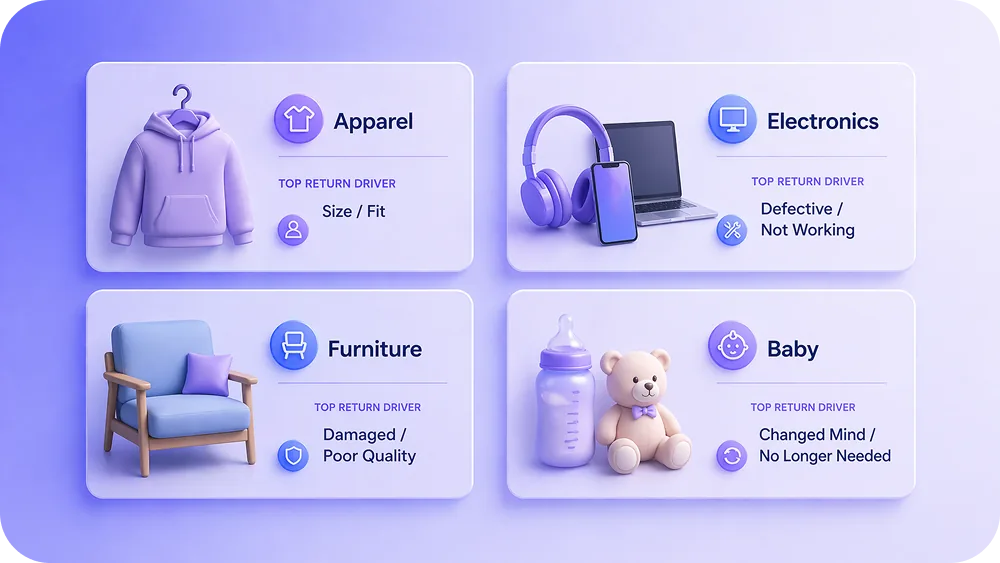
Apparel and Footwear
Fit and sizing drive most returns. Models focus on bracketing detection, size recommendation accuracy, and customer fit history. Brands investing in virtual try-on or AR tools see measurable improvements.
Electronics and Consumer Tech
Defects, compatibility issues, and buyer's remorse are top return drivers. Prediction models here weight product review sentiment and technical specification complexity heavily. Brands like those in the electronics industry benefit from connecting warranty claims data with return prediction.
Furniture and Home Goods
Returns in this category are expensive due to item size and weight. Prediction focuses on delivery damage risk, room measurement mismatches, and material expectation gaps. Claimlane works with brands in the furniture industry to automate damage claims and track recurring quality issues.
Baby and Nursery
Safety concerns and strict regulations add complexity. Return prediction models need to account for regulatory recall risk and heightened customer sensitivity. The baby and nursery sector requires particularly responsive claims handling.
Measuring the Impact of Predictive Returns Analytics
Track these KPIs to measure whether prediction is working.
- Return rate reduction: Overall and by segment/category
- Cost per return: Should decrease as high-cost returns are flagged earlier
- Return reason shift: Fewer "didn't match description" returns suggest listing improvements are working
- Customer lifetime value: Ensure return rate reduction isn't coming at the expense of purchase volume
- Model accuracy (AUC-ROC): Target 0.75+ for production models
- Intervention conversion rate: How often do pre-purchase nudges actually prevent a return?
For a comprehensive look at returns and warranty metrics, check out Claimlane's guide to 20 returns and warranty KPIs to track.
Getting Started with Predictive Returns Analytics
Brands don't need a data science team of 20 to start. Here's a phased approach.
Phase 1: Audit Your Data (Week 1-2)
Map all data sources related to orders, returns, and customers. Identify gaps and quality issues. If return reason data is inconsistent or missing, fix that first. A self-service claims portal captures structured data (photos, reasons, order details) that makes prediction far more accurate.
Phase 2: Start with Descriptive Analytics (Week 3-4)
Before predicting, understand what's happening. Build dashboards showing return rates by product, category, customer segment, and time period. Use Claimlane's analytics tools to visualize claim patterns.
Phase 3: Build Your First Model (Month 2-3)
Start with a simple logistic regression or gradient boosting model. Use 6 to 12 months of historical data. Focus on getting a working pipeline before optimizing accuracy.
Phase 4: Deploy and Iterate (Month 4+)
Integrate the model into your order flow. Start with low-risk interventions (size recommendations, proactive emails). Measure impact, retrain the model monthly, and gradually expand the action set.
The Future of Returns Prediction
Several trends will shape predictive returns analytics in the coming years.
Multimodal AI. Models that analyze product images, customer reviews, and structured data together will predict returns more accurately than any single data source.
Real-time scoring at checkout. Instead of batch predictions, every cart will get a return risk score that dynamically adjusts the experience, from shipping options to return policy terms.
Cross-brand data sharing. Anonymized return data shared across brands (through platforms, not directly) will improve prediction accuracy for newer products with limited history.
Integration with AI agents. Predictive scores will feed directly into autonomous agents that handle claims end-to-end without human intervention for low-risk cases.
.webp)

