

What does refund rate mean?
Refund rate is the percentage of orders that end in money returned to the customer rather than an exchange or store credit. The formula:
**Refund rate = (Refunded orders / Total orders) × 100**
A store with 1,000 orders and 80 refunds has an 8% refund rate.
Three related metrics often get confused. Here's how they differ:
A healthy refund rate sits 30 to 50% below the total return rate. Well-run brands convert a meaningful share of returns into exchanges or store credit, which keeps the revenue in the business.
Refund rate is one of 20 returns and warranty KPIs that matter for ecommerce brands in 2026. The full list below covers formulas, industry benchmarks, and practical ways to improve each one.
Most ecommerce brands track acquisition metrics obsessively. Cost per click, conversion rate, average order value. Every dollar spent getting customers to buy is measured, optimized, and reported on weekly.
But what happens after the sale? Returns, warranty claims, and post-purchase support are where brands quietly bleed money. The average ecommerce return rate sits between 20 and 30%, and warranty claims add another layer of cost that most brands measure poorly or not at all.
The brands that win in 2026 are the ones that treat returns and warranty management as a measurable, improvable system, not a cost center to ignore. That starts with tracking the right KPIs.
Here are the 20 returns and warranty KPIs that actually matter, with formulas, benchmarks, and practical ways to improve each one.
Returns KPIs
These metrics cover the full returns lifecycle, from how often products come back to how much each return costs the business.
1. Return Rate
What it measures: The percentage of sold items that get returned.
Formula: (Total returned items / Total items sold) x 100
Benchmark: 20-30% for ecommerce overall. Apparel runs higher (30-40%), electronics lower (10-15%), furniture lower still (5-10%).
Why it matters: Return rate is the top-level health check for your post-purchase experience. A rising return rate signals problems with product quality, descriptions, sizing, or customer expectations. A falling return rate means your prevention efforts are working.
How to improve it: Break return rate down by product category, SKU, and return reason. The aggregate number hides the specific problems. A 25% overall return rate might mean one product line is at 60% while the rest are at 10%. Fix the outliers first. Better product descriptions, accurate sizing guides, and high-quality images reduce returns driven by mismatched expectations. Brands dealing with delivery exceptions should track those separately from true product returns, since shipping damage inflates return rate without reflecting product quality issues.
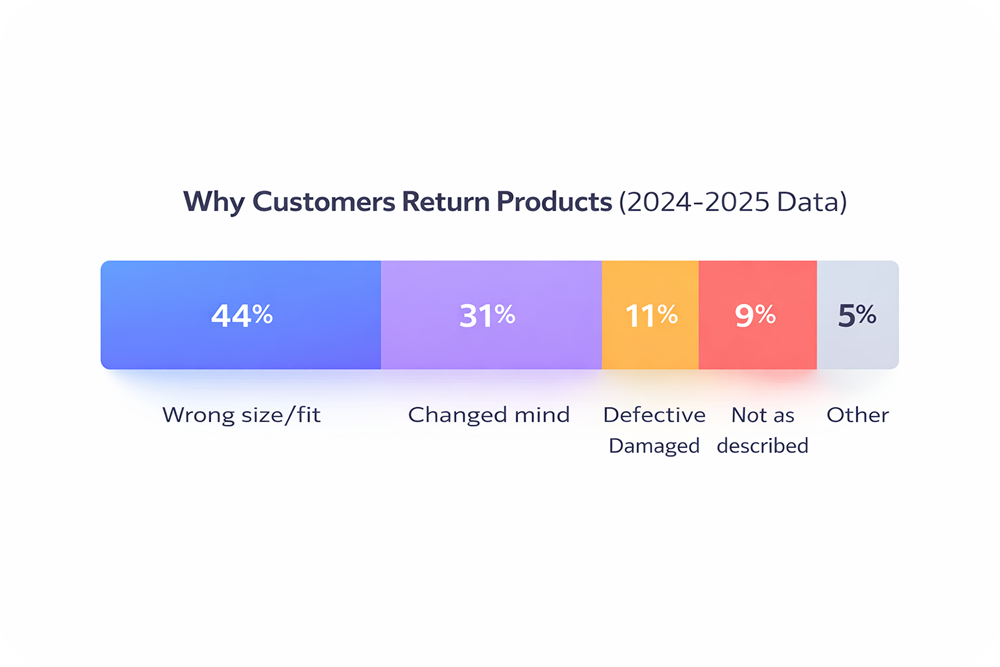
2. Return Reason Breakdown
What it measures: The distribution of reasons why customers return products.
Formula: (Returns per reason / Total returns) x 100
Benchmark: Industry averages from 2024-2025 data show: wrong size or fit (44%), changed mind (31%), defective or damaged (11%), not as described (9%), other (5%).
Why it matters: Not all returns are equal. A return for "wrong size" is a prevention problem (better sizing tools). A return for "defective" is a quality problem. A return for "changed mind" might be acceptable within your business model. Knowing the split tells you where to invest.
How to improve it: Categorize return reasons consistently. Use structured dropdown options in your self-service portal, not free-text fields. Analyze trends monthly and tie specific actions to each category. If "defective or damaged" is a growing segment, investigate whether the root cause is shipping damage or manufacturing quality. If return fraud is suspected (e.g., wardrobing or empty box returns), break that out as its own category to track it separately.
3. Refund Rate
What it measures: The percentage of orders that result in a refund (as opposed to an exchange or store credit).
Formula: (Total refunded orders / Total orders) x 100
Benchmark: Varies widely. Healthy brands aim for a refund rate 30-50% lower than their total return rate, meaning they convert a portion of returns into exchanges or store credit.
Why it matters: Every refund is revenue lost permanently. Exchanges and store credit retain the revenue within your business. A high refund rate relative to your return rate means you are not offering compelling alternatives.
How to improve it: Make exchanges frictionless. Offer instant exchanges through your returns portal. Add incentives for store credit (e.g., 10% bonus credit). Present exchange and credit options before the refund option in the returns flow. Understanding the difference between refunds, payment reversals, and chargebacks also helps you track where revenue is actually going after a return.
4. Exchange Rate
What it measures: The percentage of returns that convert to exchanges instead of refunds.
Formula: (Total exchanges / Total returns) x 100
The healthy signal is not the absolute number, it's the gap between refund rate and total return rate. Best-run brands maintain a refund rate 30 to 50% below their total return rate by converting returns into exchanges or store credit.
Benchmark: Top-performing brands convert 30-40% of returns into exchanges. The average is closer to 10-15%.
Why it matters: Every refund is revenue lost permanently. Exchanges and store credit retain the revenue within the business. A high refund rate relative to return rate means the brand is not offering compelling alternatives.
How to improve it: Make exchanges frictionless with instant exchanges through the returns portal. Add incentives for store credit, like a 10% bonus. Present exchange and credit options before the refund option in the returns flow. Understanding the difference between refunds, payment reversals, and chargebacks also helps brands track where revenue is actually going after a return. For a breakdown of when each option makes sense, see store credit vs refund.
5. Cost Per Return
What it measures: The total cost of processing a single return, including shipping, labor, restocking, and customer service.
Formula: Total returns processing costs / Total returns processed
Benchmark: $15-30 per return for most ecommerce brands. Higher for heavy or bulky items (furniture, appliances). Lower for lightweight goods processed through automated systems.
Why it matters: Cost per return is the metric that connects returns operations to the P&L. If your cost per return is $25 and you process 10,000 returns per month, that is $250,000 in monthly operating cost. Even a 10% reduction saves $25,000 per month.
How to improve it: Automate return authorization and label generation. Use returnless refunds for items where return shipping exceeds the product value. Consider whether your restocking fee policy is offsetting costs or simply discouraging returns. Reduce back-and-forth communication by collecting all required information upfront through a structured portal. For brands using third-party fulfillment, 3PL returns management adds another cost layer that should be factored into this metric.
6. Return Processing Time
What it measures: The average time from when a customer initiates a return to when the return is fully resolved (refund issued, exchange shipped, or claim closed).
Formula: Sum of (resolution date - return initiation date) / Total returns
Benchmark: Best-in-class brands resolve returns in 2-4 days. The industry average is 7-14 days. Brands without automated workflows often take 14-21 days.
Why it matters: Speed directly impacts customer satisfaction and repeat purchase behavior. Research consistently shows that faster return resolution increases the likelihood of a customer buying again. Every day a return sits unresolved is a day the customer is unhappy.
How to improve it: Automate the steps that do not require human judgment: acknowledgment emails, return label generation, refund approval for low-value items. Use rule-based automation through platforms like Claimlane to auto-resolve routine returns and flag only exceptions for manual review. Send automatic status emails at each stage so customers are not left wondering what is happening.
7. Returnless Refund Rate
What it measures: The percentage of returns resolved without requiring the customer to ship the item back.
Formula: (Returnless refunds / Total returns) x 100
Benchmark: 10-20% of returns for most brands. Amazon reportedly processes over 50% of eligible returns as returnless.
Why it matters: For low-value items, requiring a return costs more than the product is worth. A $5 item with $8 return shipping is a net loss even before restocking labor. Tracking this metric helps optimize the threshold at which returnless refunds make financial sense.
How to improve it: Set automated rules based on item value, category, and customer history. Items below a certain cost threshold get auto-approved for returnless refunds. High-value items always require a physical return. Review the threshold quarterly as costs change.
8. Revenue Retained from Returns
What it measures: The percentage of original order value retained through exchanges, store credit, or upsells during the returns process.
Formula: (Value of exchanges + store credit issued + upsell revenue) / Total original order value of returns x 100
Benchmark: Best-in-class brands retain 30-40% of the revenue that would otherwise be lost to refunds.
Why it matters: This is the KPI that reframes returns from a pure cost center into a revenue retention opportunity. It measures how well your returns process converts a negative experience into continued customer engagement.
How to improve it: Offer bonus store credit (e.g., "get 10% extra if you choose store credit over refund"). Recommend alternative products during the return flow. Use data from past purchases and the return reason to suggest products the customer is more likely to keep. The post-purchase experience does not end at delivery. Brands that treat returns as part of the customer journey, not the end of it, retain significantly more revenue.
Warranty KPIs
Warranty metrics are often overlooked by ecommerce brands, but they directly impact product quality decisions, supplier relationships, and customer lifetime value.
9. Warranty Claim Rate
What it measures: The percentage of products sold that generate a warranty claim within the warranty period.
Formula: (Total warranty claims / Total units sold under warranty) x 100
Benchmark: 1-5% for consumer electronics. 2-8% for furniture and home goods. Under 2% for well-manufactured products with strong quality control.
Why it matters: Warranty claim rate is the clearest signal of product reliability. A rising claim rate for a specific SKU or product line is an early warning that something is wrong, whether it is a manufacturing batch issue, a design flaw, or a supplier quality problem.
How to improve it: Track claim rate by SKU, supplier, and time period. Use product analytics to identify trends before they become widespread. A structured warranty claims processing workflow ensures every claim is categorized consistently, which makes trend analysis possible. Share claim data with suppliers as part of quarterly business reviews. Require root cause analysis for any product with a claim rate above your threshold.
10. Average Claim Cost
What it measures: The average cost to resolve a single warranty claim, including replacement product cost, shipping, labor, and any repairs.
Formula: Total warranty claim costs / Total claims resolved
Benchmark: Varies enormously by product category. Consumer electronics: $30-80. Furniture: $50-200. Outdoor gear: $20-60. The key is tracking trend over time, not comparing to other industries.
Why it matters: Average claim cost tells you whether your warranty program is financially sustainable. If claim costs are rising, it could mean product costs are increasing, shipping rates are up, or the mix of claim types is shifting toward more expensive resolutions.
How to improve it: Offer repair options instead of full replacements when appropriate. Negotiate supplier cost recovery agreements so defective product costs are shared. Use supplier forwarding to push manufacturing defect costs back to the responsible supplier.
11. Warranty Cost as Percentage of Revenue
What it measures: Total warranty costs as a share of total revenue.
Formula: (Total warranty costs / Total revenue) x 100
Benchmark: 1-3% for most consumer product companies. Over 5% signals a significant product quality or process problem.
Why it matters: This is the executive-level metric that connects warranty operations to business profitability. It answers the question: "How much of our revenue are we spending to fix products after the sale?"
How to improve it: Reduce claim rates through better quality control. Lower average claim costs through automation and supplier recovery. Extend warranty periods strategically (longer warranties signal confidence and can reduce pre-purchase hesitation without dramatically increasing costs if product quality is strong).
12. Claim Approval Rate
What it measures: The percentage of submitted warranty claims that are approved.
Formula: (Approved claims / Total submitted claims) x 100
Benchmark: 70-85% for most brands. Below 70% may indicate overly strict policies or poor communication of warranty terms. Above 90% may indicate insufficient verification.
Why it matters: A low approval rate frustrates customers and creates support overhead from disputes. A high approval rate without proper verification invites fraud. The sweet spot balances customer experience with financial protection.
How to improve it: Write clear warranty terms that set customer expectations upfront. Use AI image analysis to verify damage claims automatically, reducing subjective judgment. Implement tiered approval: auto-approve low-risk claims, flag high-risk claims for review.
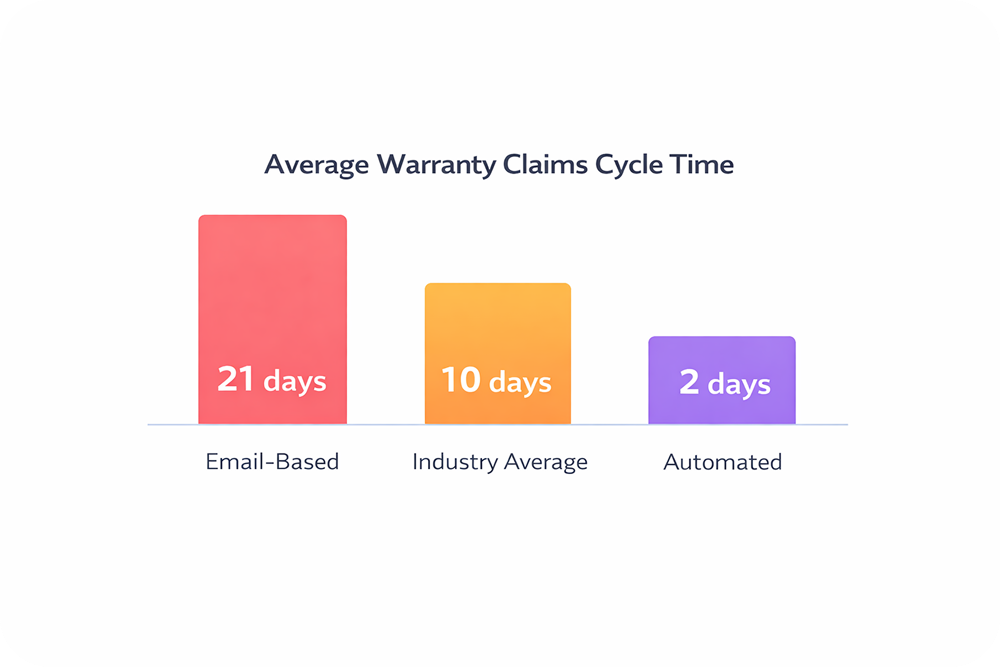
13. Claims Cycle Time
What it measures: The average time from warranty claim submission to final resolution.
Formula: Sum of (resolution date - submission date) / Total claims
Benchmark: Best-in-class: 1-3 days. Industry average: 7-14 days. Brands relying on email-based workflows: 14-30 days.
Why it matters: Long cycle times destroy customer trust. A customer waiting 3 weeks for a warranty resolution is actively considering switching brands. MaxGaming, the largest gaming ecommerce in Scandinavia, cut RMA resolution time by 77% after automating their warranty workflow.
How to improve it: Automate claim intake with structured forms. Use rule-based routing so claims go directly to the right person or workflow. Set SLA targets and track them. Auto-escalate claims approaching SLA breach. Brands exploring AI-powered claims processing can cut cycle times even further by using image recognition and rule-based automation to handle routine claims without agent involvement.
14. Supplier Recovery Rate
What it measures: The percentage of warranty costs successfully recovered from suppliers for manufacturing defects.
Formula: (Costs recovered from suppliers / Total warranty costs for supplier-caused defects) x 100
Benchmark: 40-60% for brands with informal supplier agreements. 70-90% for brands with structured supplier claim workflows and contractual recovery terms.
Why it matters: Many brands absorb the full cost of warranty claims even when the defect was caused by the supplier. Every dollar not recovered from a supplier is margin lost unnecessarily.
How to improve it: Include warranty cost recovery clauses in supplier contracts. Document defects with photo and video evidence through the claims process. Use automated supplier forwarding to send documented claims to suppliers with all required evidence attached. Track recovery rates by supplier and renegotiate with underperforming partners.
Operational Efficiency KPIs
These metrics measure how efficiently your team handles the volume of returns and claims.
15. First Contact Resolution Rate
What it measures: The percentage of returns and claims resolved on the first customer interaction, without follow-up.
Formula: (Claims resolved on first contact / Total claims) x 100
Benchmark: 70-80% for brands with structured intake processes. Below 50% for brands relying on email-based workflows.
Why it matters: Every follow-up interaction costs money and frustrates the customer. If agents need to ask for additional photos, missing order numbers, or clarifying details, it means the initial intake process is not collecting enough information.
How to improve it: Design your claims portal to require all necessary information before submission: product photos, order number, damage description, preferred resolution. Use conditional logic so the form adapts based on the claim type. Davidsen, one of Scandinavia's largest DIY retailers, reduced claims staffing from 5 to 1-2 agents by implementing structured intake.
16. Automation Rate
What it measures: The percentage of returns and claims processed without human intervention.
Formula: (Auto-resolved claims / Total claims) x 100
Benchmark: 20-30% for brands starting with automation. 40-60% for mature programs with well-defined rules. 60%+ for brands with AI-powered claims processing.
Why it matters: Automation rate directly impacts cost per claim and cycle time. Every claim that resolves automatically frees an agent to handle complex cases that actually need human judgment.
How to improve it: Start with the simplest cases: low-value refunds, clear-cut warranty claims with photo evidence, and repeat returns from known product issues. Build rule-based workflows that auto-approve claims matching specific criteria. Expand automation coverage as confidence in the rules grows. If you are evaluating tools, the best warranty management software options include automation as a core feature, not an add-on.
17. Claims Per Agent Per Day
What it measures: The average number of returns and warranty claims processed per support agent per day.
Formula: Total claims processed / (Number of agents x Working days)
Benchmark: 15-25 claims per agent per day with manual processes. 40-80 claims per agent per day with automated workflows handling routine cases.
Why it matters: This is a productivity metric that helps with staffing decisions. If claim volume grows 20% but each agent can handle more claims due to automation, you may not need to hire.
How to improve it: Automate repetitive tasks (label generation, status updates, approval of low-risk claims). Provide agents with pre-populated claim summaries so they spend time deciding, not researching. Use AI to suggest resolutions so agents confirm rather than create from scratch.
Customer Experience KPIs
These metrics measure how returns and warranty processes affect customer relationships.
18. Post-Return Repeat Purchase Rate
What it measures: The percentage of customers who make another purchase within 90 days after a return.
Formula: (Customers who purchased again within 90 days of return / Total customers who returned a product) x 100
Benchmark: 20-30% is average. Brands with excellent return experiences achieve 40-50%. Brands with poor return experiences drop below 15%.
Why it matters: This is the ultimate measure of whether your returns process builds loyalty or destroys it. A customer who returns a product and buys again is more valuable than a customer who silently never returns. The return experience is a make-or-break moment.
How to improve it: Resolve returns fast (within 48 hours). Send proactive status updates through automatic status emails. Offer personalized product recommendations during the returns flow. Follow up with a targeted offer 2-3 weeks after the return is resolved. Understanding consumer buying behavior and returns helps you predict which customer segments are most likely to return and buy again.
19. CSAT for Returns and Claims
What it measures: Customer satisfaction score specifically for the returns and warranty claims experience.
Formula: (Positive ratings / Total ratings) x 100
Benchmark: 70-80% is average. 85%+ is excellent. Below 60% indicates serious process problems.
Why it matters: General CSAT scores hide problems in specific touchpoints. A brand can have 90% overall CSAT but 50% returns CSAT, meaning returns are quietly eroding loyalty. Measuring returns-specific CSAT isolates this critical touchpoint.
How to improve it: Send a brief survey after every resolved return or claim. Keep it simple: one rating question and one open-text question. Act on feedback quickly. Share returns CSAT with the team weekly so everyone sees the impact of their work.
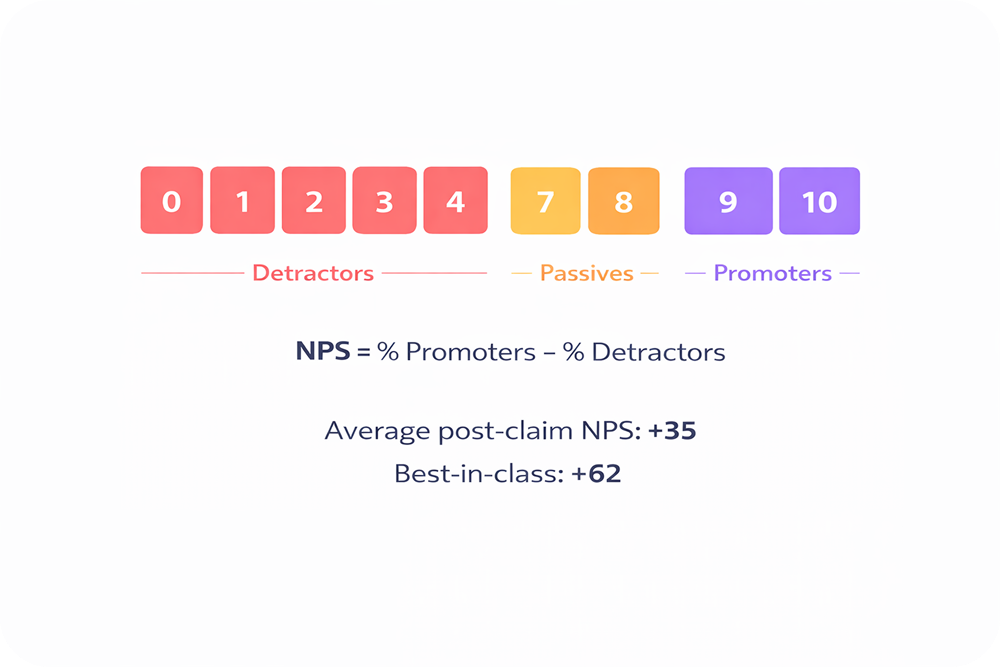
20. Net Promoter Score After Claims Resolution
What it measures: How likely customers are to recommend the brand after a warranty claim or return experience.
Formula: % Promoters (9-10 rating) - % Detractors (0-6 rating)
Benchmark: +30 to +50 is good for post-claim NPS. +50 to +70 is excellent and indicates your claims process is a competitive advantage. Negative NPS means claims are actively driving customers away.
Why it matters: NPS after a claims interaction is one of the strongest predictors of long-term customer value. Research shows that customers who have a claim resolved quickly and generously often become more loyal than customers who never had an issue (the "service recovery paradox").
How to improve it: Speed is the single biggest driver of post-claim NPS. Resolve claims within your SLA 95%+ of the time. Empower frontline agents to make resolution decisions without multi-level approvals. Follow up personally on detractor feedback.
How to Build a Returns and Warranty KPI Dashboard
Tracking 20 KPIs is only useful if the data is accessible and actionable. Here is how to build a dashboard that actually gets used.
Start with 5 metrics, not 20
Don't try to track everything at once. Start with the five metrics that have the biggest impact on your business:
- Return rate (the health check)
- Cost per return (the P&L impact)
- Claims cycle time (the customer experience indicator)
- Automation rate (the efficiency measure)
- Post-return repeat purchase rate (the loyalty indicator)
Once these five are tracked consistently, layer in the remaining metrics as your process matures.
Connect your data sources
Most brands have returns data spread across multiple systems: the ecommerce platform (Shopify, WooCommerce), the helpdesk (Zendesk, Freshdesk), the shipping provider, and spreadsheets. A platform like Claimlane centralizes returns and warranty data with built-in analytics that calculate these KPIs automatically. If your ecommerce logistics stack includes a 3PL, make sure their returns data feeds into the same dashboard.
Review weekly, act monthly
Check KPIs weekly to spot anomalies (a sudden spike in return rate for a specific product). Make strategic decisions monthly based on trends (investing in better packaging for high-damage SKUs, renegotiating with an underperforming supplier).
Benchmark against yourself first
Industry benchmarks are helpful for context, but your improvement trajectory matters more. If your cost per return dropped from $30 to $22 over six months, that is meaningful progress regardless of what the industry average is.
Common Mistakes When Tracking Returns KPIs
Avoid these pitfalls that make returns data misleading or useless.
Tracking return rate without segmentation
An aggregate return rate hides everything. Break it down by product category, price band, acquisition channel, and customer segment. Returns from paid social ads might be 3x higher than returns from organic search. That changes your CAC math entirely.
Ignoring the cost of time
Many brands calculate cost per return using only direct costs (shipping, product replacement). They forget agent time, which often costs more than the shipping label. A 15-minute interaction at a fully loaded agent cost of $40/hour adds $10 to every return.
Measuring speed without measuring quality
Fast resolutions are meaningless if customers are unhappy with the outcome. Always pair cycle time metrics with satisfaction metrics. A 2-day resolution that leaves the customer frustrated is worse than a 4-day resolution that leaves them delighted.
Not connecting returns data to product decisions
Returns data is one of the most valuable product feedback loops available. If 40% of returns for a specific jacket are "wrong size," that is a product team problem, not a returns team problem. Build a bridge between your returns data and your product development process.
Comparing to irrelevant benchmarks
A luxury furniture brand should not benchmark against a fast-fashion retailer. Industry benchmarks are starting points, not targets. Your competitive set and business model determine what "good" looks like for your brand.
The KPIs That Matter Most by Role
Different stakeholders care about different metrics.
.webp)

