.webp)
Reverse logistics is one of the hardest parts of ecommerce to plan for. Unlike outbound shipping, where demand follows sales forecasts, return volumes are driven by factors that are harder to predict: seasonal patterns, product quality issues, promotional campaigns that attract buyers who are more likely to return, and even weather.
Most brands plan reverse logistics capacity reactively. They staff up after returns spike and scramble for warehouse space after a holiday season surge. AI demand forecasting changes this by predicting return volumes before they materialize, giving operations teams time to prepare.
This article covers how AI forecasts return demand, the data that feeds the models, and how brands use these predictions to optimize warehouse capacity, staffing, and processing workflows.
- Return volumes are harder to predict than sales because they depend on product quality, seasonal patterns, and customer behavior.
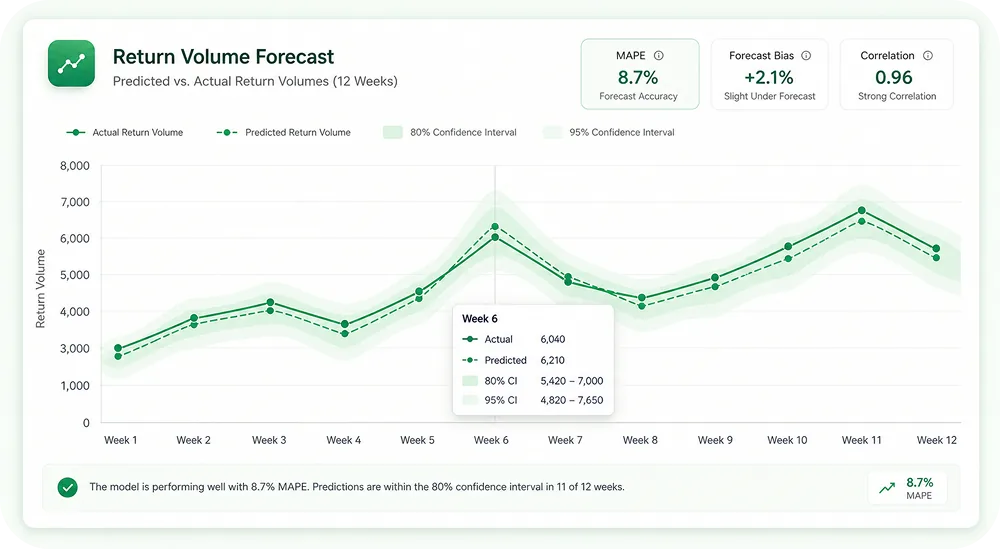
- AI models use sales data, historical return rates, and warranty claims data to forecast return volumes 2-8 weeks ahead.
- Accurate forecasting helps brands right-size warehouse capacity, staffing, and carrier contracts.
- Claimlane's AI Agent provides structured returns data that feeds forecasting models.
Why Return Volumes Are Hard to Predict
Outbound logistics follows a relatively predictable pattern: marketing campaigns drive traffic, traffic drives orders, and orders drive shipments. The relationship between marketing spend and outbound volume is well understood.
Return volumes don't follow the same logic. They're driven by:
- Product-specific return rates. A fashion brand's new collection might have a 35% return rate while basics run at 15%. Until the products ship and customers receive them, the exact rate is uncertain.
- Seasonal patterns. Holiday gifting creates a January return surge. Summer fashion launches create a different pattern. Average return rates vary significantly by season.
- Quality issues. A manufacturing defect in a production batch can spike returns for a specific SKU overnight.
- Promotional behavior. Deep discounts attract price-sensitive buyers who return at higher rates. Free returns policies encourage more speculative purchasing.
- Bracketing. Customers ordering multiple sizes or colors and returning the ones that don't work.
Without forecasting, reverse logistics teams operate blind. They discover the return surge when pallets of returns start piling up in the warehouse.
How AI Forecasts Return Demand
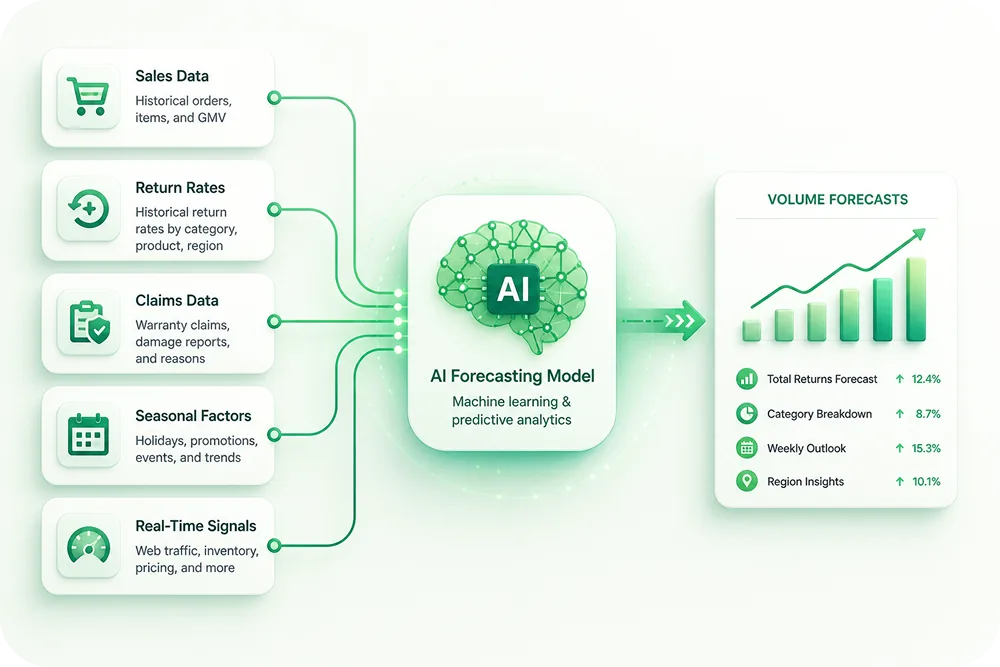
AI demand forecasting for reverse logistics uses historical patterns and real-time signals to predict how many returns will arrive in the coming weeks, broken down by product category, return reason, and processing type.
The Data That Feeds the Model
Sales data (leading indicator)
Returns follow sales with a lag. If 10,000 units shipped this week and the product category has a historical return rate of 20%, the model predicts approximately 2,000 returns arriving 7-21 days later. The lag varies by category and geography.
Historical return rates by product
Not all products return at the same rate. AI models learn product-specific return rates from historical data and apply them to current sales volumes. New products get estimates based on similar products in the same category.
Warranty claims data
Warranty claims are a separate return stream with different timing. Products under warranty can generate claims months or years after purchase. Claimlane's analytics tracks claim patterns by product age, defect type, and volume, feeding predictive models for warranty-related return volumes.
Seasonal and calendar patterns
Return volumes spike predictably after holidays, major sales events (Black Friday, Prime Day), and end-of-season clearances. The model learns these patterns from historical data.
Real-time return initiation data
When customers initiate a return through a self-service portal like Claimlane's, the system knows a return is coming before the package ships back. This provides a 3-7 day early warning signal for warehouse planning.
Operational Applications

Warehouse Capacity Planning
Returns need warehouse space for receiving, inspection, grading, and restocking. If a brand knows that 5,000 returns will arrive next week (instead of the usual 3,000), the warehouse team can allocate additional staging areas, schedule extra receiving dock time, and prepare quality inspection stations.
Staffing Optimization
Return processing is labor-intensive. Each item needs to be received, inspected, graded (resellable, refurbish, recycle), and routed. Understaffing leads to processing backlogs and delayed refunds. Overstaffing wastes money. AI forecasting lets operations managers schedule the right number of processing staff based on predicted volumes.
Carrier Contract Optimization
Reverse logistics carriers offer better rates for predictable volumes. When a brand can commit to a steady return shipment volume based on AI forecasts, carriers offer lower per-package rates. Unpredictable volumes lead to spot rates and premium charges.
Refund and Exchange Processing
Predicting return volumes also means predicting refund processing needs. Finance teams can manage cash flow better when they know that $200,000 in refunds will process next week versus $100,000. Brands using store credit instead of refunds can prepare marketing campaigns for the expected credit balances.
Inventory Recovery Planning
Returned products that can be resold represent recovered inventory. Forecasting return volumes by product helps merchandising teams plan inventory levels more accurately. If 500 units of a popular item are expected back next week, the team can adjust reorder quantities accordingly.
Claimlane's Role in Reverse Logistics Forecasting
Claimlane provides the structured returns and claims data that makes AI demand forecasting possible. Without consistent, machine-readable return data, forecasting models struggle.
Claimlane is rated 4.8/5 on G2.
Structured return reason data. The self-service portal captures why customers return products, with consistent AI-classified categories. This tells the forecasting model not just how many returns to expect, but what type (size issue, defect, preference).
Real-time return initiation signals. When a customer initiates a return through Claimlane, the warehouse gets advance notice. This short-term signal (3-7 days) complements the longer-term AI forecast.
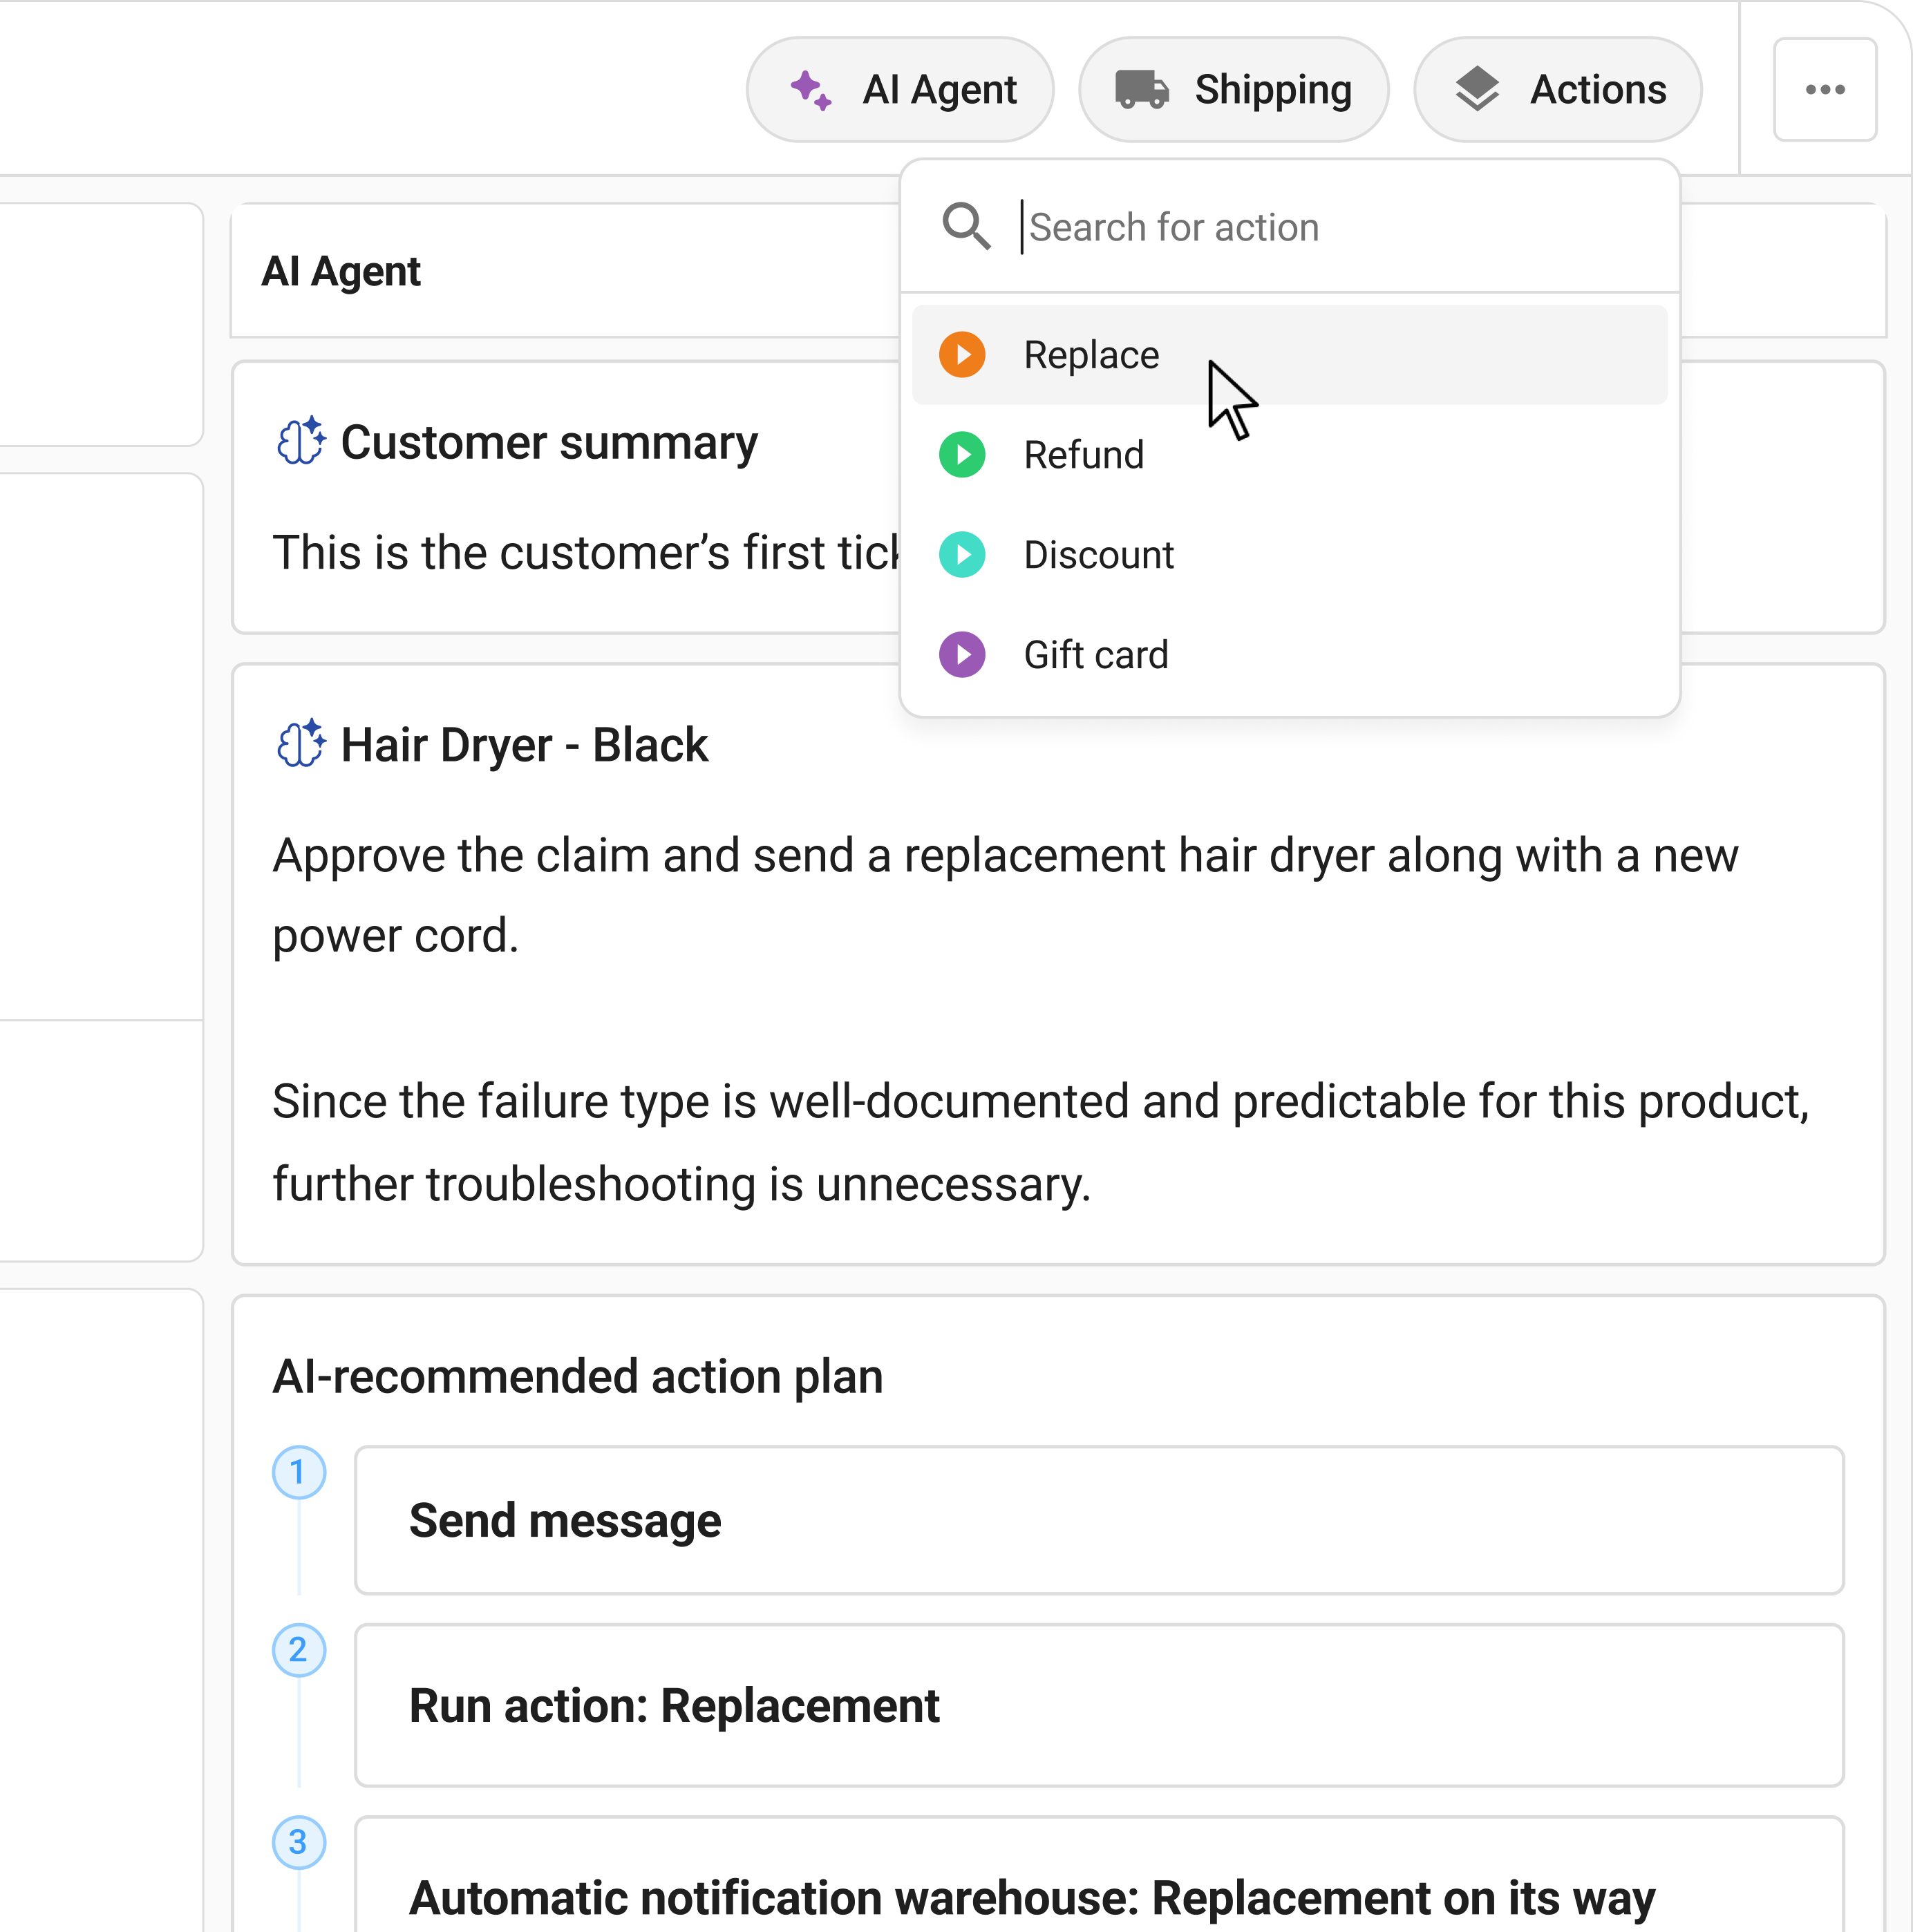
AI-powered defect detection. Claimlane's AI Agent, the first AI agent purpose-built for warranty claims and returns, classifies defect types from photos. When defect claims spike for a specific product, the model adjusts the return forecast for that SKU upward.
Product-level analytics. Claimlane's analytics breaks down return rates by product, category, reason, and time period. This granular data feeds category-specific forecasting models.
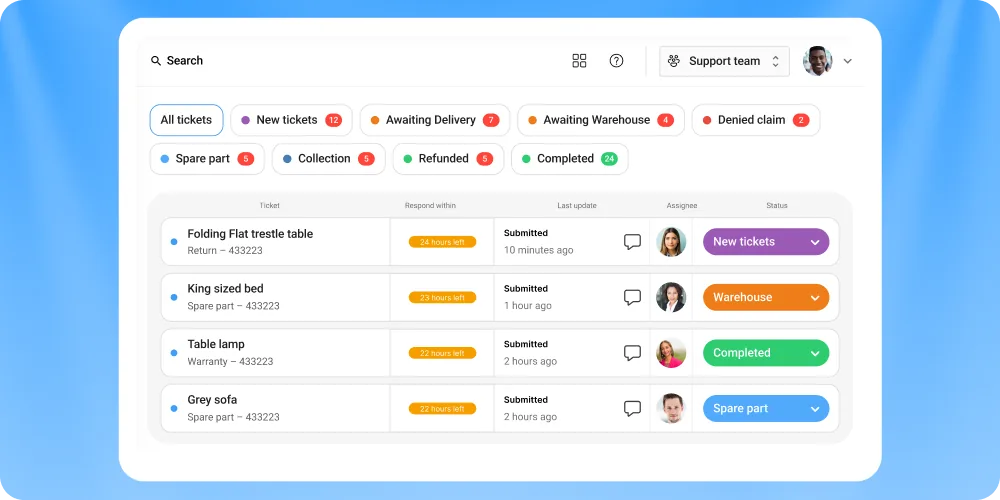
ERP integration. Through 75+ integrations, return data flows into ERP and WMS systems where capacity planning happens. Business Central and NetSuite users can connect claims data directly to inventory and warehouse planning.
Book a demo to see how Claimlane's data feeds reverse logistics forecasting.
.webp)