

Warranty management is the part of operations that does not get clean credit when it works. Customers do not write reviews about how fast a claim was approved. Suppliers do not thank brands for chasing credit notes. But when warranty management is bad, every other metric in the operation drags: support load, repeat purchase rate, NPS, supplier costs.
The 8 practices below come from operations leaders running warranty at brands like Davidsen, Skechers, Coolshop, and Sebras. They are action-led, not philosophy. Each one names the specific shift to make and the metric that moves when it works.
What "Best Practice" Means in 2026
Best practice in warranty has shifted with the cost structure. Five years ago, the bar was "close claims in two weeks without losing the customer." In 2026, brands that hold that bar lose to competitors closing in two days. The cost is not just the support team. It is the supplier credit note still pending after six months, the SKU that should have been pulled from the catalogue, and the customer who already left for a competitor.
The goalposts move because the tools moved. The 4 pillars of a warranty claims software covers what those tools should do at a minimum, and the warranty management software landing page shows what modern coverage looks like.
Practice 1: Centralise Claim Intake

The most common pattern in struggling warranty operations is a fragmented intake. Customers email support, fill out a form, message the brand on Instagram, or call the dealer. Each channel feeds a different inbox. Nothing reconciles.
The fix is one intake point with channel adapters. Customers can still reach the brand any way they want, but every channel routes into the same structured claim record. A self-service portal is the cleanest pattern because it forces the customer to attach photos, order data, and serial numbers up front, which is exactly what the warranty rule needs to check.
Metric that moves: claims with complete data on first submission. Target: 80%+.
Practice 2: Set SLAs by Claim Category
A single SLA across all claims is a setup for failure. A damaged-in-transit claim with clear photos should close in 24 hours. A wear-and-tear dispute on a 10-month-old product needs investigation and might take 5 to 7 days, fairly. Forcing them into the same target either pushes agents to rush the complex ones or makes the simple ones look slow.
Tier the SLAs:
- Damaged in transit (clear evidence): 24-48 hours
- Manufacturer defect (within 90 days): 2-3 business days
- Out-of-window or contested: 5-7 business days
- Supplier-routed cases: tracked separately by supplier SLA
The warranty SLA management guide covers tier design. The why warranty claims take 2 weeks piece shows the failure modes.
Metric that moves: SLA compliance per category. Target: 90%+ per tier.
Practice 3: Automate the Rule Check First
Most warranty teams try to automate the whole workflow on day one. That fails because edge cases overwhelm the model. The pattern that works is automating the rule check first, then layering AI on top.
Rules are deterministic. Within warranty window? Yes or no. Eligible category? Yes or no. Photo attached? Yes or no. Get the rule check right, then add AI to read the photo, classify the defect, and recommend a resolution. Claimlane's AI Agent, the first AI agent purpose-built for warranty claims and returns, follows this pattern.
The optimize your warranty claim process guide goes through it step by step, and the AI warranty claims automation piece covers what to automate vs leave to humans.
Metric that moves: auto-resolved share. Target: 30-60% depending on category.
Practice 4: Make Supplier Handoff Structured
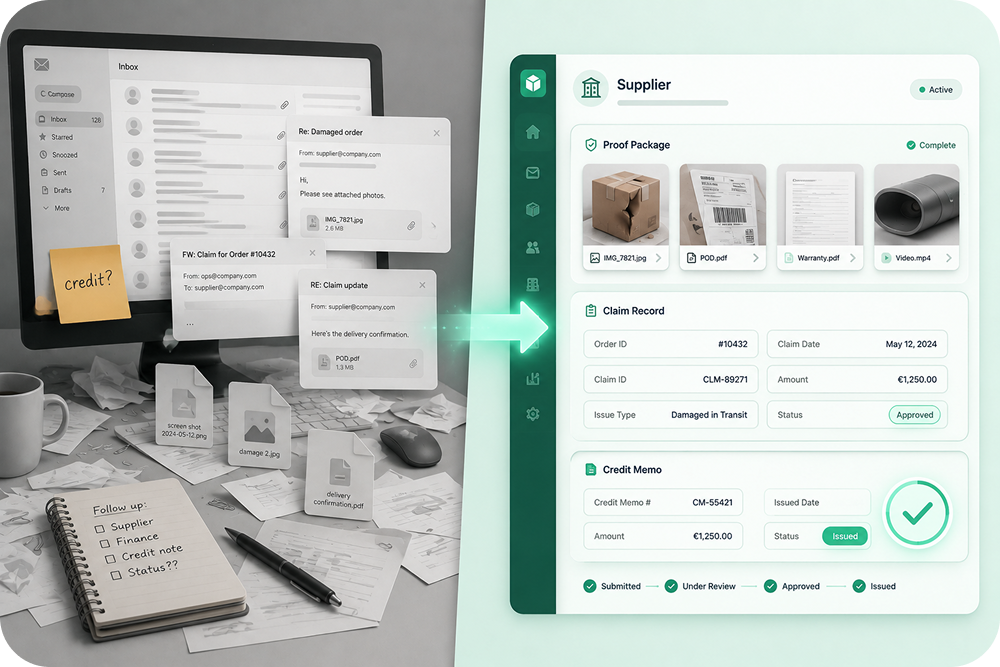
In many warranty operations, supplier handoff is a forwarded email with a photo attached. Six weeks later, the support team chases a credit note that nobody can find.
Structured supplier handoff means the supplier receives a complete proof package (claim record, photos, video, serial number, order data) plus a tracked status. The supplier responds inside the system, the brand sees the response in context, and the credit note status sits next to the claim itself. The forward to supplier feature is built for exactly this, and the supplier recovery guide and supplier chargebacks piece cover what good looks like.
Practice 5: Build a Repair-vs-Replace Decision Rule
Every warranty operation hits the same fork: repair the unit or replace it. Without a rule, agents decide case by case and the cost varies. With a rule, the decision is consistent, defensible, and traceable.
A workable rule combines:
- Cost of repair vs replacement (including labor, parts, logistics)
- Time to repair vs ship a replacement
- Customer's stated preference
- Product category lifecycle position (new SKU vs end-of-life)
The repair vs replace warranty claims guide walks through the math, and the right to repair home appliances piece covers EU compliance angles.
Metric that moves: average cost per claim. Target: down 15-25% within 90 days of rule rollout.
Practice 6: Track the Right Metrics, Not All of Them
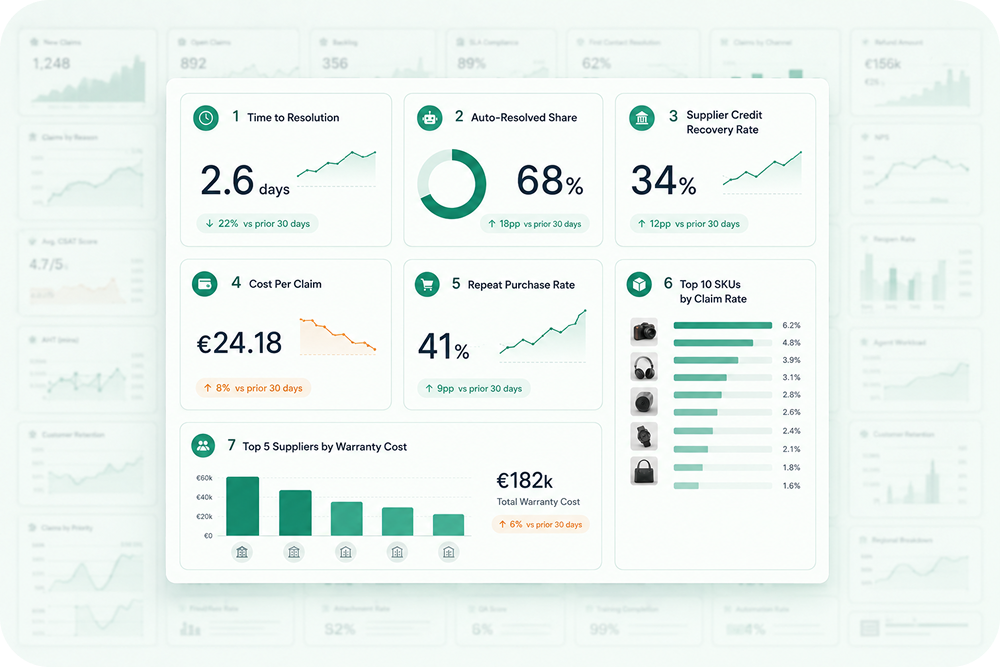
Most warranty dashboards measure 25 things and nothing changes. The shortlist that actually drives behaviour:
- Time to resolution by category
- Auto-resolved share
- Supplier credit recovery rate
- Cost per claim (fully loaded)
- Repeat purchase rate after a resolved claim
- Top 10 SKUs by claim rate
- Top 5 suppliers by warranty cost
The returns and warranty KPIs piece has benchmarks. The warranty analytics for product quality piece covers SKU-level analytics. The customer-centric warranty analytics view ties the same data to retention. All of this comes out of the box in Claimlane analytics.
Metric that moves: clarity of weekly ops review. If the team cannot recite the top 3 numbers, the dashboard is wrong.
Practice 7: Make Warranty Data Useful to Procurement
Warranty data is often locked inside the support team. Procurement does not see which suppliers cost the brand most through warranty claims. Quality assurance does not see which SKUs are trending toward higher claim rates.
The practice is to make warranty data a shared input to procurement and QA reviews. A weekly export, a shared dashboard, or a slack-ready summary turns warranty from a support cost into a sourcing signal. The AI supplier quality scoring and predictive warranty analytics pieces cover how to score suppliers from claim data. The Davidsen case study shows what that looks like in practice, with the warranty team going from 5 agents to 1 to 2 because the same data became useful to multiple departments.
Metric that moves: number of supplier or QA decisions made monthly using warranty data. Target: 3+ per month.
Practice 8: Close the Loop with the Customer
The last practice is the one most ops teams skip because it does not feel operational. After a resolved claim, the customer is in one of two emotional states: relieved, or still resentful. The brand that proactively follows up converts more of the first into repeat buyers and catches the second before they write the review.
A simple post-resolution flow:
- Confirmation that the case is closed
- Short CSAT survey (1 question)
- For low scores, automatic escalation to a senior agent
- For high scores, a personalised follow-up (offer, content, or just a thank-you)
The why warranty claim process builds customer loyalty piece covers the retention math, and the customer retention after returns piece shows how to design the follow-up flow.
Metric that moves: repeat purchase rate within 90 days of a claim. Target: above pre-claim baseline.
Three Best Practices That Quietly Fail

Most warranty playbooks repeat the same advice. A useful test is checking what falls apart in production. Three commonly recommended practices fail more often than the industry admits.
"Set one ambitious global SLA and rally the team around it." This sounds energising and breaks under category mix. A 48-hour SLA across all claims pushes agents to rush 7-day investigations and slow-walk 24-hour shipping damage cases. Teams hitting their numbers run tiered SLAs and post the tier compliance separately. Practice 2 above covers the tier design and the warranty SLA management piece covers the math.
"Automate end-to-end on day one." This sounds bold and produces the highest rate of mid-rollout reversals in the industry. Without rule clarity and clean intake, AI inherits dirty data and makes confident wrong decisions, which is harder to correct than the manual baseline. The pattern that works is automate intake, then rules, then AI on top, in that order. Practice 3 covers the sequencing.
"Track everything and dashboard it." This sounds thorough and produces 25-metric dashboards no operator can act on. The teams that move warranty performance track six to eight metrics and review them weekly. Everything else is on-demand and rarely pulled. Practice 6 covers the shortlist.
The pattern across all three: warranty operations rewards focused investment over wide investment. A small number of well-implemented practices outperforms a long checklist done halfway. The thinking in workflows piece covers the broader mindset, and the 4 changes that save hours piece covers what focused investment actually looks like in week 1.
What Procurement Wishes Warranty Teams Understood
Warranty data is the single best leading indicator of supplier quality, and procurement rarely sees it on time. The disconnect runs both ways. Warranty teams treat claim data as a support metric. Procurement runs supplier scorecards on lead time, price, and on-time delivery without looking at the post-purchase claim tail.
The brands that close this gap put one number in the procurement weekly review: warranty cost per supplier as a percentage of the supplier's spend. Once that number is on the slide, sourcing conversations change. Suppliers with high warranty cost get squeezed on price or replaced. Suppliers with low warranty cost get more category share. The AI supplier quality scoring piece and the supplier management piece cover the scoring methodology.
For operations leaders, this is the most underused lever in warranty management. The work to surface the data is small. The change in supplier behaviour is large.
Common Pitfalls Even Mature Ops Teams Hit
Three patterns trip up teams that already have the basics right.
Over-automation in B2B claims. B2B has context and relationships AI cannot read. Keep humans in the loop for high-value cases. The B2B warranty claims piece covers the nuances.
Letting policy drift without telling the system. When the policy team changes warranty terms, the workflow tool needs the update on the same day. A two-week lag creates approvals against rules that no longer apply.
Treating supplier claims as a separate motion. It is the same workflow with a different actor at the end. The retailer challenges with supplier claims piece covers the failure modes.
A Maturity Model for Warranty Operations
Most teams sit at level 2 or 3.
Level 1 (manual): Email intake, spreadsheet tracking, no SLAs by category, supplier follow-up is ad hoc.
Level 2 (organised): Centralised intake, basic SLAs, ticketing system, no AI, supplier handoff via email.
Level 3 (rules-based): Self-service portal, rule-based eligibility checks, ticket macros, basic analytics, supplier handoff in a tool.
Level 4 (AI-assisted): Rules plus AI image review and recommendation. Auto-resolved share above 30%. Supplier recovery rate above 60%.
Level 5 (predictive): Same as level 4 plus predictive analytics on supplier and SKU trends. Warranty data is shared with QA and procurement weekly.
The 10 practical questions for operations leaders piece and the thinking in workflows piece help diagnose the current level. Teams looking at adjacent topics will also find the AI customer success playbook useful for the retention side and the Intercom integrations guide useful for the front-line tooling.
G2 Recognition
Claimlane's 4.8/5 G2 rating comes from operations and customer service leaders running these practices in production.
Operations Leader Checklist
A failing check on any of these is a clear next sprint candidate. The warranty process health check tool runs a longer version.
FAQ
Conclusion
Warranty management best practices in 2026 are operational, not aspirational. Centralise intake. Tier SLAs. Run rules before AI. Structure supplier handoff. Track the small set of metrics that actually move behaviour.
Brands that hit all eight practices end up where Davidsen is: warranty as a small, efficient team that produces useful data for the rest of the business, not a bottleneck. Book a walkthrough at /book-demo to see the full playbook in warranty management software.
.webp)

