Most brands sit on years of warranty claim data without using it. The data lives in spreadsheets, scattered emails, and individual agents' heads. The patterns it would surface, which SKUs fail most, which suppliers cause repeat issues, which packaging changes would cut damage rates by half, stay invisible until a quarterly review surfaces them by accident.
Warranty claims are a feedback channel. Brands that treat them that way catch product quality problems early, recover costs from suppliers, and reduce the volume of future claims. Brands that don't keep paying for the same defects in the same SKUs every quarter.
This guide covers what to track, how to act on it, and what real customer outcomes look like when warranty data becomes operational.
What's covered
01
What it costs to ignore claim data
03
What decisions the data drives
04
How AI changes the math in 2026
What it costs to ignore warranty claim data
Brands without a structured claim data pipeline pay three recurring costs.
The same defects repeat. A SKU that's responsible for 40% of returns in a category keeps shipping with the same defect because nobody connects the claims back to the manufacturing or design root cause. The team handles the same complaint over and over.
Supplier accountability erodes. Without quantified evidence, supplier conversations become anecdotal complaints instead of data-backed renegotiations. Suppliers who consistently underperform stay in the lineup because nobody can prove how badly.
Quality investments target the wrong problems. When defect patterns aren't visible, brands invest in solving the most-recently-complained-about problems instead of the most expensive ones. The squeaky wheel gets the budget, not the leaking one.
What untracked claim data actually costs
- Up to 20% of returns are defect-driven. For a brand at $10M revenue with 20% returns, that's roughly $400K in product cost going back without anyone knowing why.
- Repeat defects compound quietly. Each unaddressed defect issue costs the brand again every batch.
- Supplier recovery rates stay low. Without structured evidence, brands recover 50-65% of supplier-responsible costs instead of 80%+.
- Customer trust erodes. Customers who get the same product fault twice rarely come back for a third try.
A guide on the hidden costs of returns and claims breaks down the financial side in more detail.
What to track in warranty claim data
The exact data points that turn warranty claims from a cost center into a feedback channel.
01
Claim rate by SKU
Claims as a percentage of units sold per SKU. Surfaces which products are responsible for disproportionate volume.
02
Defect type by SKU
Same SKU might fail in three different ways. Each maps to a different fix (manufacturing, packaging, design).
03
Supplier defect rate
Claims tied to each supplier as a percentage of units shipped. The single most useful number for supplier reviews.
04
Lifecycle stage of failure
Pre-use, during transit, after first use, after extended use. Each stage points at a different root cause.
05
Resolution time per case
Identifies which defect types or suppliers consistently slow cases down.
06
Cost recovered from suppliers
Approved supplier chargebacks as a percentage of claims tied to supplier responsibility.
The pre-use vs post-use distinction is the most useful piece. A product that fails before the customer uses it points at packaging, transit, or pre-shipment quality control. A product that fails after extended use points at design or component sourcing. Different problems, different fixes.
A deeper guide on returns and warranty KPIs covers the metric set in more detail.
What decisions the data drives
Warranty data becomes useful when it triggers specific decisions. Five common ones:
01
Renegotiate supplier terms
When supplier defect rate is documented, conversations move from "we have quality issues" to "your defect rate is 3.2x category average, here's what changes."
02
Kill or refresh underperforming SKUs
SKUs with claim rates above 15% rarely make money once handling and lost-margin costs are factored in. Defect data makes the case for cutting them.
03
Change packaging or shipping handling
If 30% of claims for a SKU are damage-on-arrival, packaging is the lever. If 5% are, design or component quality is.
04
Update product descriptions and sizing data
When claim reasons cluster around "didn't match description" or "wrong size," the fix is upstream of warranty entirely. It's a product-page problem, not a quality problem.
05
Forecast and reserve for warranty liability
Historical claim rate × projected unit sales × average claim cost = warranty reserve. Finance teams that don't have this model are flying blind.
For brands wanting to take this further, predictive returns analytics covers what becomes possible once the historical data is structured.
How AI changes the math in 2026
The biggest 2026 shift in warranty data is AI handling pattern surfacing automatically instead of requiring quarterly manual analysis.
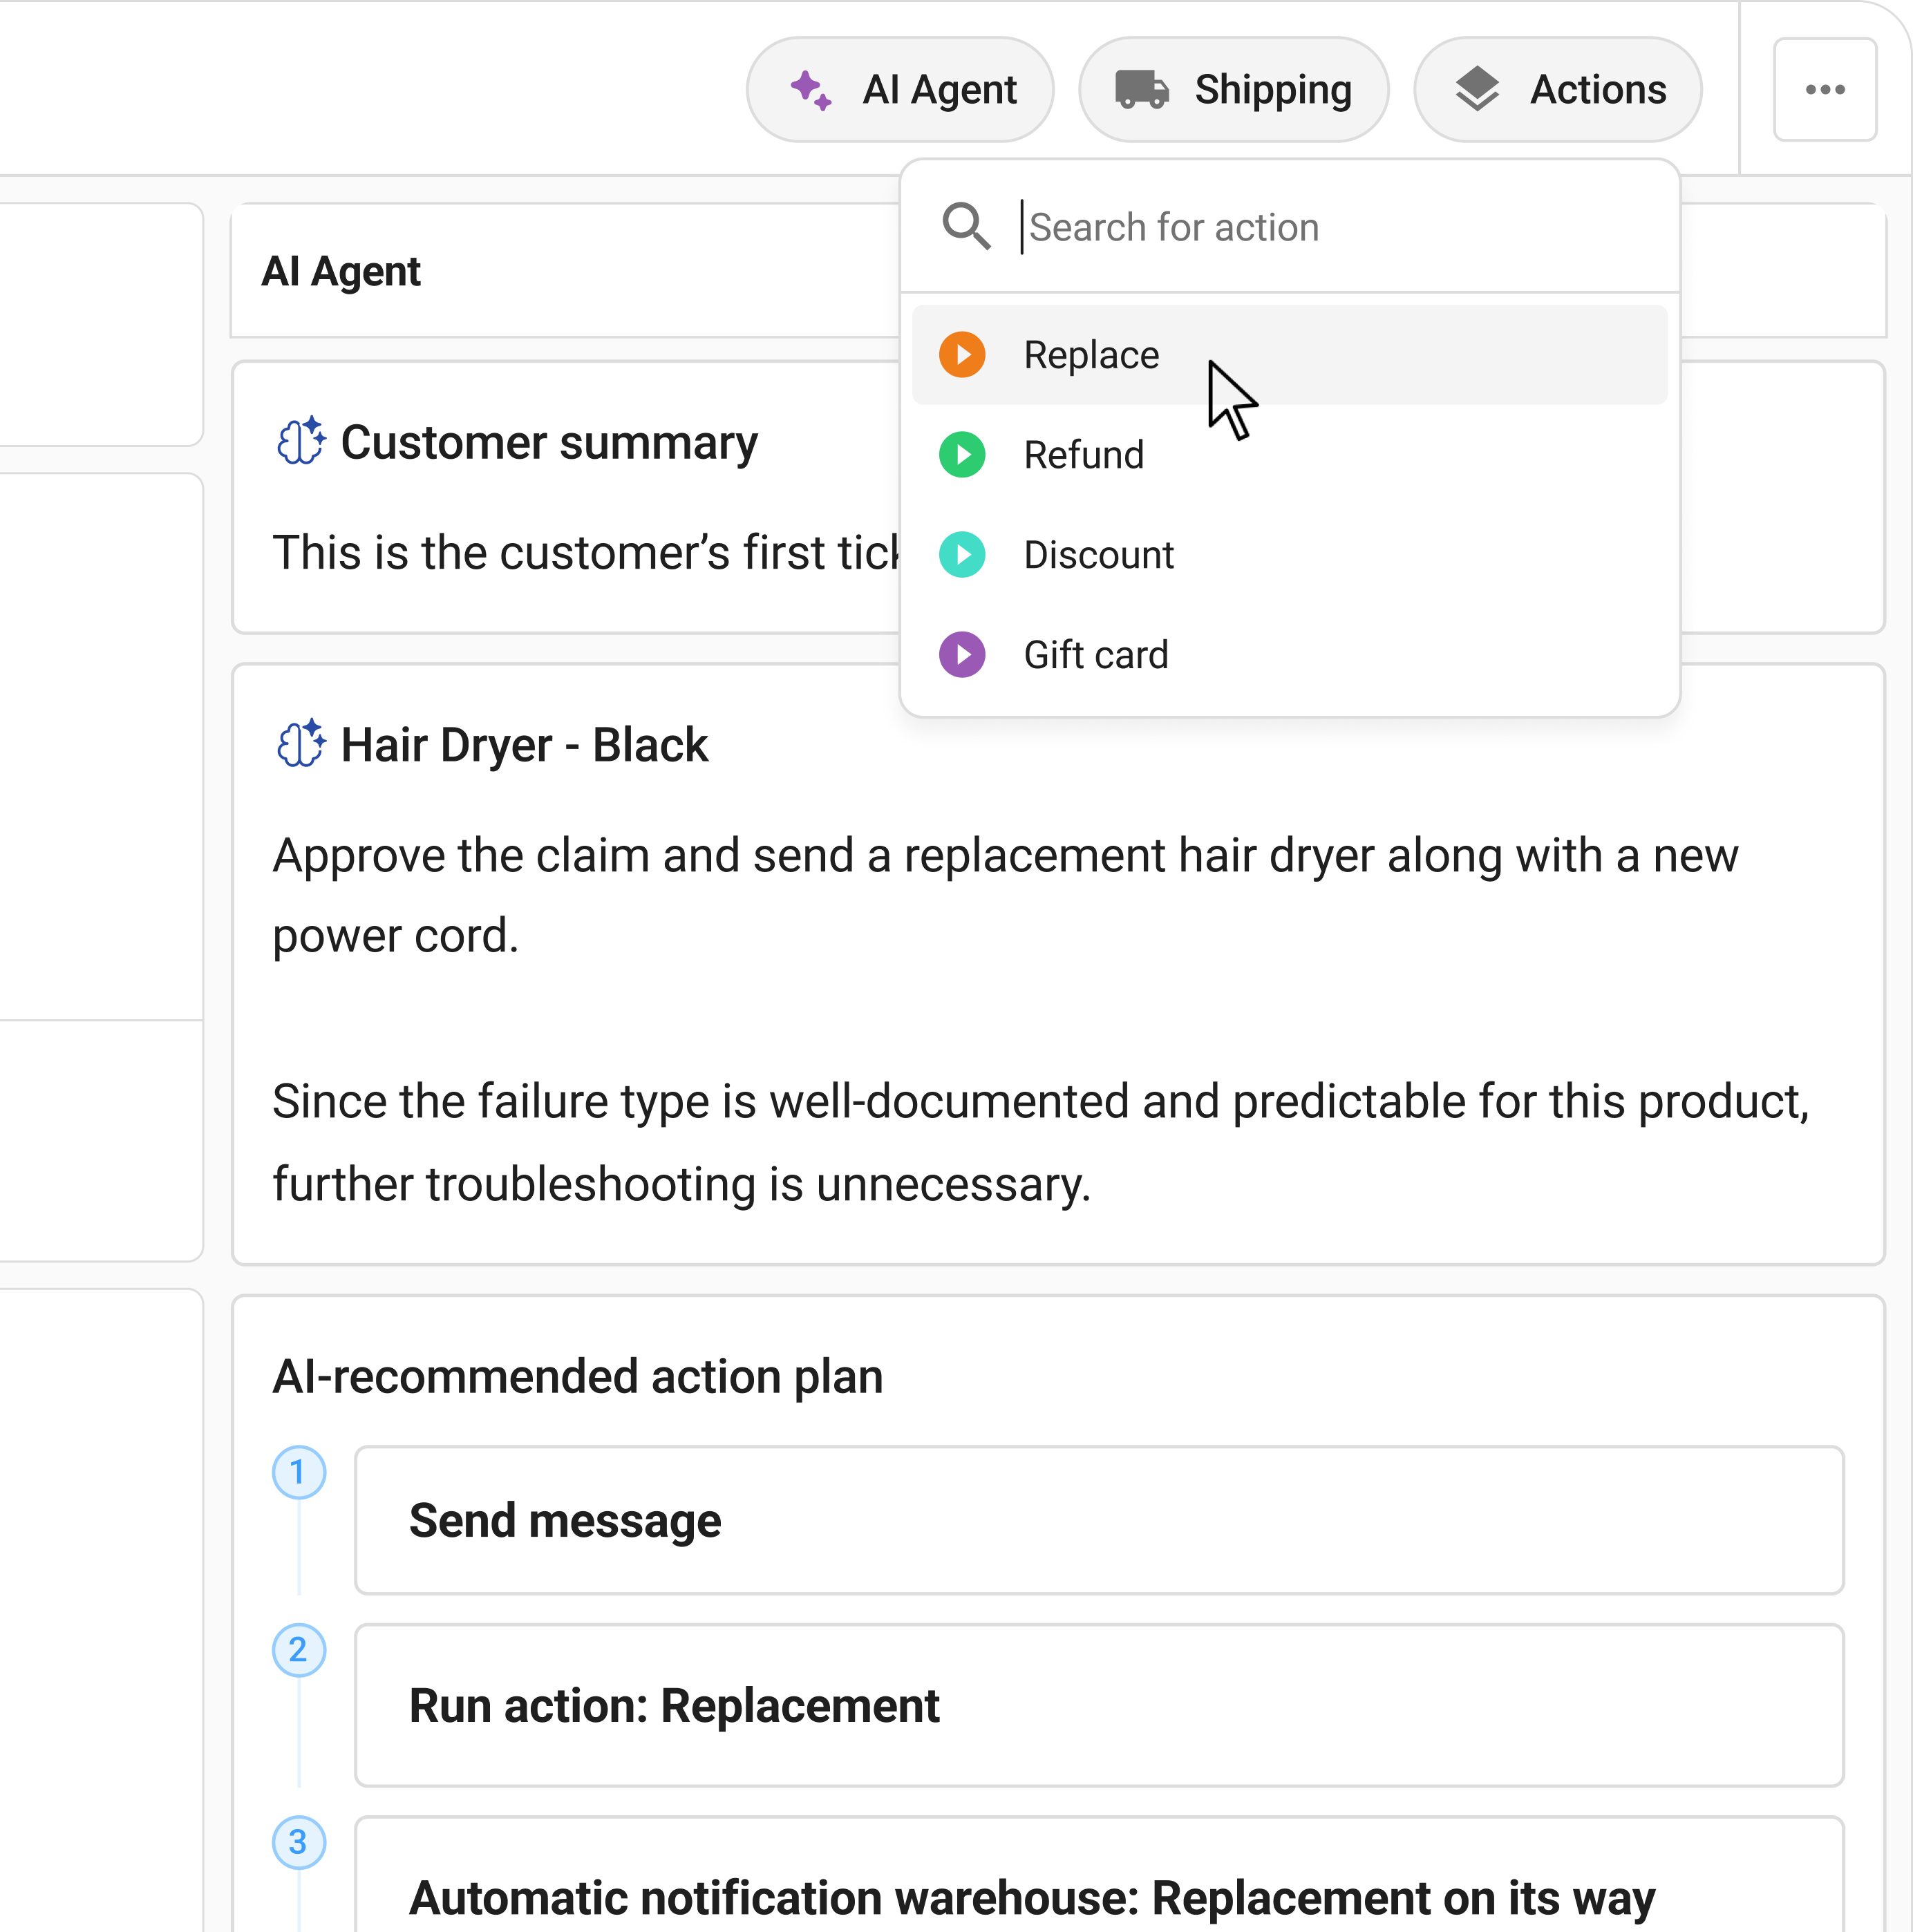
Claimlane's AI Agent, the first AI agent purpose-built for warranty claims and returns, reads photos and videos at intake, classifies defect types automatically, and applies brand and supplier rules. Defect patterns surface in real time as cases close, not in a quarterly review three months later.
This changes two things in practice. First, the team catches quality issues weeks earlier than they would otherwise. A new SKU shipping with a packaging flaw shows up in week two instead of week ten. Second, the manual data entry that previously made claim data unreliable goes away. The AI tags every case consistently, so the analytics actually mean something.
A guide on AI supplier quality scoring covers how this plays out specifically for supplier evaluation.
77%
faster RMA resolution
AI-assisted classification · MaxGaming
MaxGaming runs 30,000+ SKUs across 200+ brands. The AI Agent classifies defects per case automatically, so the data feeding their analytics is consistent and the patterns surface in real time instead of through manual coding.
What real customer outcomes look like
Three documented Claimlane customer outcomes show what happens when warranty data becomes operational.
Onyx Cookware · ROI
9x
Year-one ROI on Claimlane investment. Came from agent time saved, faster supplier chargeback recovery, and reduced lost margin on poorly-handled cases.
Read the case study
Swoon · Recovery
60 → 85%
Supplier chargeback recovery rate after switching to structured, evidence-backed real-time submissions. Suppliers respond differently when the data backs the claim.
Read the case study
Davidsen · Efficiency
5 → 1-2
Agents needed for the same warranty case volume. The data infrastructure removes manual coding that previously consumed agent time.
Read the case study
The pattern across all three: warranty data stops being a quarterly retrospective and becomes operational. The team makes decisions on it weekly. Suppliers are held accountable monthly. Product quality issues get caught in weeks instead of months.
Where to start
Most brands don't need to build sophisticated analytics from day one. Five starting moves cover most of the value.
5 starting moves
- Standardise reason codes at intake. No free-text fields. Every claim picks from a defined list.
- Capture photos as required, not optional. Evidence is the foundation of supplier accountability.
- Tag the lifecycle stage of each defect (pre-use, in-transit, post-use). One field, huge analytical payoff.
- Track per-supplier defect rate weekly. Even simple tracking catches problems before they compound.
- Review the top 10 SKUs by claim volume monthly. The Pareto principle applies hard. 20% of SKUs cause 80% of the issues.
These five steps cover the mechanical foundation. Once the data is consistent, the analytics built on top of it stop being noisy.
Frequently asked questions
What warranty claim data should I track?
Six metrics cover most of the value: claim rate by SKU, defect type by SKU, supplier defect rate, lifecycle stage of failure (pre-use, in-transit, post-use, after extended use), resolution time per case, and supplier chargeback recovery rate. The pre-use vs post-use distinction in particular points at very different root causes (packaging vs design).
How do I use warranty data to renegotiate supplier terms?
Track per-supplier defect rate as a percentage of units shipped, response time on supplier claims, and approval rate on supplier chargebacks. Reviewed quarterly, these three numbers turn supplier conversations from anecdotal complaints into data-backed renegotiations. Suppliers who know they're being measured tend to respond faster and accept claims at higher rates.
What does it cost to ignore warranty claim data?
For a typical $10M ecommerce brand with a 20% return rate where defects cause roughly 20% of returns, ignoring claim data costs at least $300-400K per year in repeat defects, low supplier recovery, and customer churn. Brands with structured analytics typically recover 80%+ from suppliers; brands without typically recover 50-65%.
Can AI improve warranty claim data quality?
Yes, in two ways. AI classifies each case consistently at intake (reading photos, applying defect taxonomies, tagging lifecycle stage) which removes the manual data-entry inconsistency that makes most warranty datasets unreliable. And AI surfaces patterns in real time as cases close instead of waiting for quarterly manual review. Claimlane's AI Agent does both inside every ticket.
How do I forecast warranty liability for finance?
Basic formula: projected unit sales × historical claim rate × average claim cost = warranty reserve. The accuracy depends on whether the claim rate is segmented by SKU (more accurate) or category-wide (less accurate). Finance teams running this monthly tend to plan inventory and margins more accurately than teams that don't.
When should I kill an underperforming SKU?
Once the unit economics including return cost, lost margin, and processing time turn negative. SKUs with claim rates above 15% rarely make money on a fully-loaded basis, even if the gross margin looks fine. Defect data is what turns this from a gut call into a defensible decision.
How quickly can warranty data drive product improvements?
Pattern detection takes 2-4 weeks of structured data once the system is in place. The fix timeline depends on the type. Packaging changes can be implemented within a single shipment cycle. Design or component changes typically take a quarter or more depending on supplier lead times. The faster the brand moves from detection to correction, the bigger the cost savings compound.
What's the ROI of better warranty claim data?
Onyx Cookware documented a 9x ROI in year one on their Claimlane investment, driven by the combination of agent time saved, faster supplier chargeback recovery, and reduced lost margin on poorly-handled cases. Swoon increased supplier recovery from 60% to 85%, a roughly 40% lift on a meaningful financial line. The exact ROI varies but the structural drivers are consistent across categories.
Warranty claim data is one of the highest-leverage data sources most ecommerce brands aren't using. The fix isn't more dashboards or more reports. It's structured intake at the case level so the data going in is consistent enough to be useful. Claimlane handles the structured intake, the AI classification, and the analytics in one platform. Book a demo and see what your warranty data would surface if it was actually consistent.

.webp)