.webp)
Return rates vary wildly by industry. A fashion brand might see 30% of orders come back. A furniture brand might see 8%. An electronics retailer sits somewhere in between. Without industry benchmarks, brands have no way to know whether their return rate is a problem or simply the cost of doing business in their category.
This guide compiles the latest return rate data across major ecommerce verticals, explains what drives the differences, and shows how brands use returns data to improve products, reduce costs, and retain customers.
- U.S. retail returns hit $849.9 billion in 2025, with online return rates averaging 20.8% across all categories.
- Fashion leads at 24-40%, driven by sizing uncertainty and bracketing. Electronics run 15-20%. Furniture sits at 5-15%.
- Return rates are a symptom, not a metric to optimize in isolation. The real question is why products come back and what to do about it.
- Brands using structured returns analytics reduce return rates by 10-25% within two quarters by fixing root causes like product descriptions, sizing, and packaging.
The Big Picture: Ecommerce Return Rates in 2026
U.S. retail returns totaled $849.9 billion in 2025, according to the National Retail Federation. Online return rates now sit above 20%, roughly double the in-store return rate of 8-10%.
The gap exists because online shoppers cannot touch, try, or test products before buying. They rely on photos, descriptions, and reviews. When the product does not match expectations, it goes back.
But average return rates hide enormous variation by category. Here is how the numbers break down.
Return Rates by Industry
| Industry | Avg Return Rate | Primary Drivers | Warranty Claims? |
|---|---|---|---|
| Fashion & Apparel | 24-40% | Sizing, color, bracketing | Rare |
| Footwear | 20-35% | Fit, comfort, width | Occasional |
| Consumer Electronics | 15-20% | DOA, compatibility | Frequent |
| Home & Garden | 10-15% | Size, color, damage | Moderate |
| Furniture | 5-15% | Size, color, shipping damage | Moderate |
| Baby & Nursery | 8-12% | Safety, size, defects | Frequent |
| Outdoor & Sporting | 10-18% | Fit, performance, defects | Frequent |
| DIY & Hardware | 8-12% | Wrong part, defect | Moderate |
| Beauty & Personal Care | 5-8% | Allergic, wrong shade | Rare |
| Food & Beverage | 1-3% | Damaged, wrong item | Very rare |
Fashion and Apparel: 24-40%
Fashion has the highest return rate of any ecommerce category. The primary driver is uncertainty about fit, color, and fabric feel. Customers cannot try clothes on before buying, so they order multiple sizes (bracketing) and return what does not fit.
Brands that invest in detailed size guides, customer photos, and virtual try-on tools see lower return rates. But even with these measures, fashion return rates remain structurally higher than other categories.
Warranty claims in fashion are rare. Most returns are preference-based. The exception is quality complaints: seams coming apart, zippers failing, fabric pilling after one wash. These are defect claims that should feed into supplier quality analysis.
Consumer Electronics: 15-20%
Electronics sit in the middle of the return rate spectrum, but the claims are more complex. DOA units, compatibility issues, battery problems, and user damage all require different handling.
The key for electronics brands is distinguishing between preference returns (changed mind, found a better deal) and defect-driven claims (DOA, functional failure). Preference returns are a marketing and product description problem. Defect claims are a quality and supplier problem.
For a detailed breakdown of electronics claims workflows, see the guide on electronics returns and warranty claims.
Furniture: 5-15%
Furniture has one of the lowest return rates, but each return costs 3-5x more than a standard parcel return because of the product size and weight. A returned sofa that costs $15 to ship out might cost $150 to ship back, plus potential damage during transit.
Many furniture brands use remote assessment (customers submit photos of the issue) to determine whether a return is necessary. For cosmetic issues, a discount or partial refund is often more cost-effective than a physical return. For structural defects, warranty claims processes need to capture detailed evidence for supplier recovery.
Brands in the furniture industry benefit from claims platforms that can handle both standard returns and warranty claims in one system.
Baby and Nursery: 8-12%
Safety is the dominant factor in baby product returns and claims. Parents return products at the first sign of a quality issue, and warranty claims often involve safety-critical defects (faulty latches, unstable structures, small parts detaching).
Brands in the baby and nursery space need claims processes that treat safety defects as urgent, route them to the right team immediately, and capture structured data for regulatory compliance.
"In the baby and nursery category, claims handling is not just about cost. It is about brand trust. Parents need to know that when they report a quality issue, the response is fast and thorough."
— Elisa Schjødt Frank, Head of Customer Service, Matas
Outdoor and Sporting Goods: 10-18%
Outdoor products face high warranty claim rates because they are used in demanding conditions. A jacket that is waterproof in the lab might leak on a mountain. A climbing harness that passes factory QC might show stitching wear after a season of use.
Brands like Black Diamond manage complex repair and warranty workflows where the same product might go through inspection, repair, and return. Analytics on defect types help product teams identify whether failures are design-related, material-related, or usage-related.
What Drives Return Rate Differences
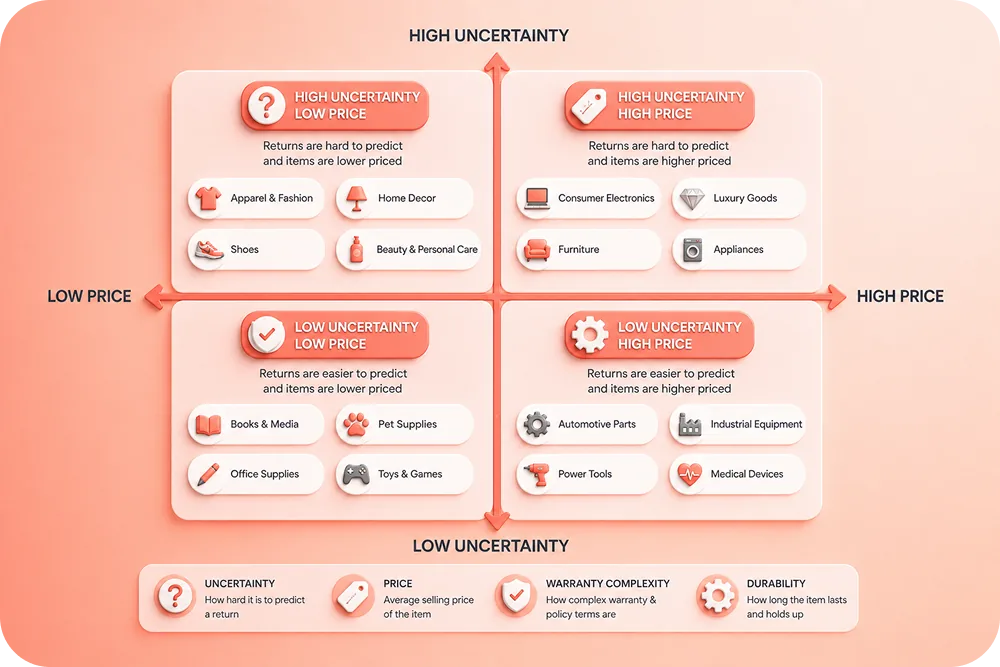
The variation across industries comes down to four factors:
1. Product Uncertainty
The harder it is to evaluate a product online, the higher the return rate. Fashion (fit, feel, color) has high uncertainty. Electronics (specs, compatibility) has moderate uncertainty. Food (you know what rice looks like) has low uncertainty.
2. Price Point
Higher-priced items generally have lower return rates because customers research more before purchasing. But when returns do happen, the cost per return is higher.
3. Warranty Complexity
Categories with complex warranty terms (electronics, outdoor gear, baby products) generate more warranty claims on top of standard returns. These claims require different processes than preference returns.
4. Product Durability
Products that experience physical stress (outdoor gear, sporting equipment, electronics) fail more often than products that sit on a shelf (home decor, books). Durability directly affects claim rates.
How to Benchmark Your Return Rate
Comparing your return rate to the industry average is a starting point, but the real value comes from understanding your return rate composition.
Break Down by Return Reason
A 20% return rate means something very different if 15% is sizing-related (fixable with better size guides) versus 15% is defect-related (fixable with better suppliers). Structured return reason codes are essential.
Track by Channel
Return rates from your own website, marketplaces, and wholesale channels will differ. Marketplace returns tend to run higher because customers cannot interact with your brand content before purchasing.
Normalize by Product Category
A blended return rate across categories hides the real patterns. Calculate return rates per category or product line to identify where the problems are concentrated.
Compare Over Time
A return rate trend matters more than a single snapshot. If your rate is improving quarter over quarter, current strategies are working. If it is flat or rising, something has changed.
Claimlane's analytics dashboard provides all of these views: by reason, by channel, by category, and over time. For details on which events to track, see the guide on returns analytics events.
Strategies for Reducing Return Rates

Improve Product Information
Better photos, detailed measurements, customer-submitted images, and video demos reduce "not as expected" returns. Brands that invest in rich product content see 10-15% lower return rates for affected products.
Collect Structured Return Reasons
Generic reasons like "other" or "didn't like it" tell you nothing. Structured defect categories in the return flow identify specific, actionable issues.
Use Returns Data to Fix Products
When the same defect generates claims repeatedly, the fix is in the product, not the returns process. Feeding claims data back to product teams and suppliers through supplier quality reporting breaks the cycle.
Offer Better Pre-Purchase Support
Live chat, compatibility tools, and AR try-on features help customers make better purchase decisions. The return that never happens costs nothing.
Optimize Packaging
Shipping damage drives returns in every category. Better packaging reduces damaged-in-transit claims.
The True Cost of Returns
Return rates only tell part of the story. The cost of each return matters just as much.
A fashion return might cost $10-15 (return shipping, processing, repackaging). A furniture return might cost $100-200 (freight, inspection, potential write-off). An electronics return with a repair workflow might cost $30-50 (diagnosis, parts, labor).
Multiplied by volume, these costs determine whether a brand's returns process is a manageable expense or a margin killer. For a full breakdown, see the guide on the true cost of returns for ecommerce.
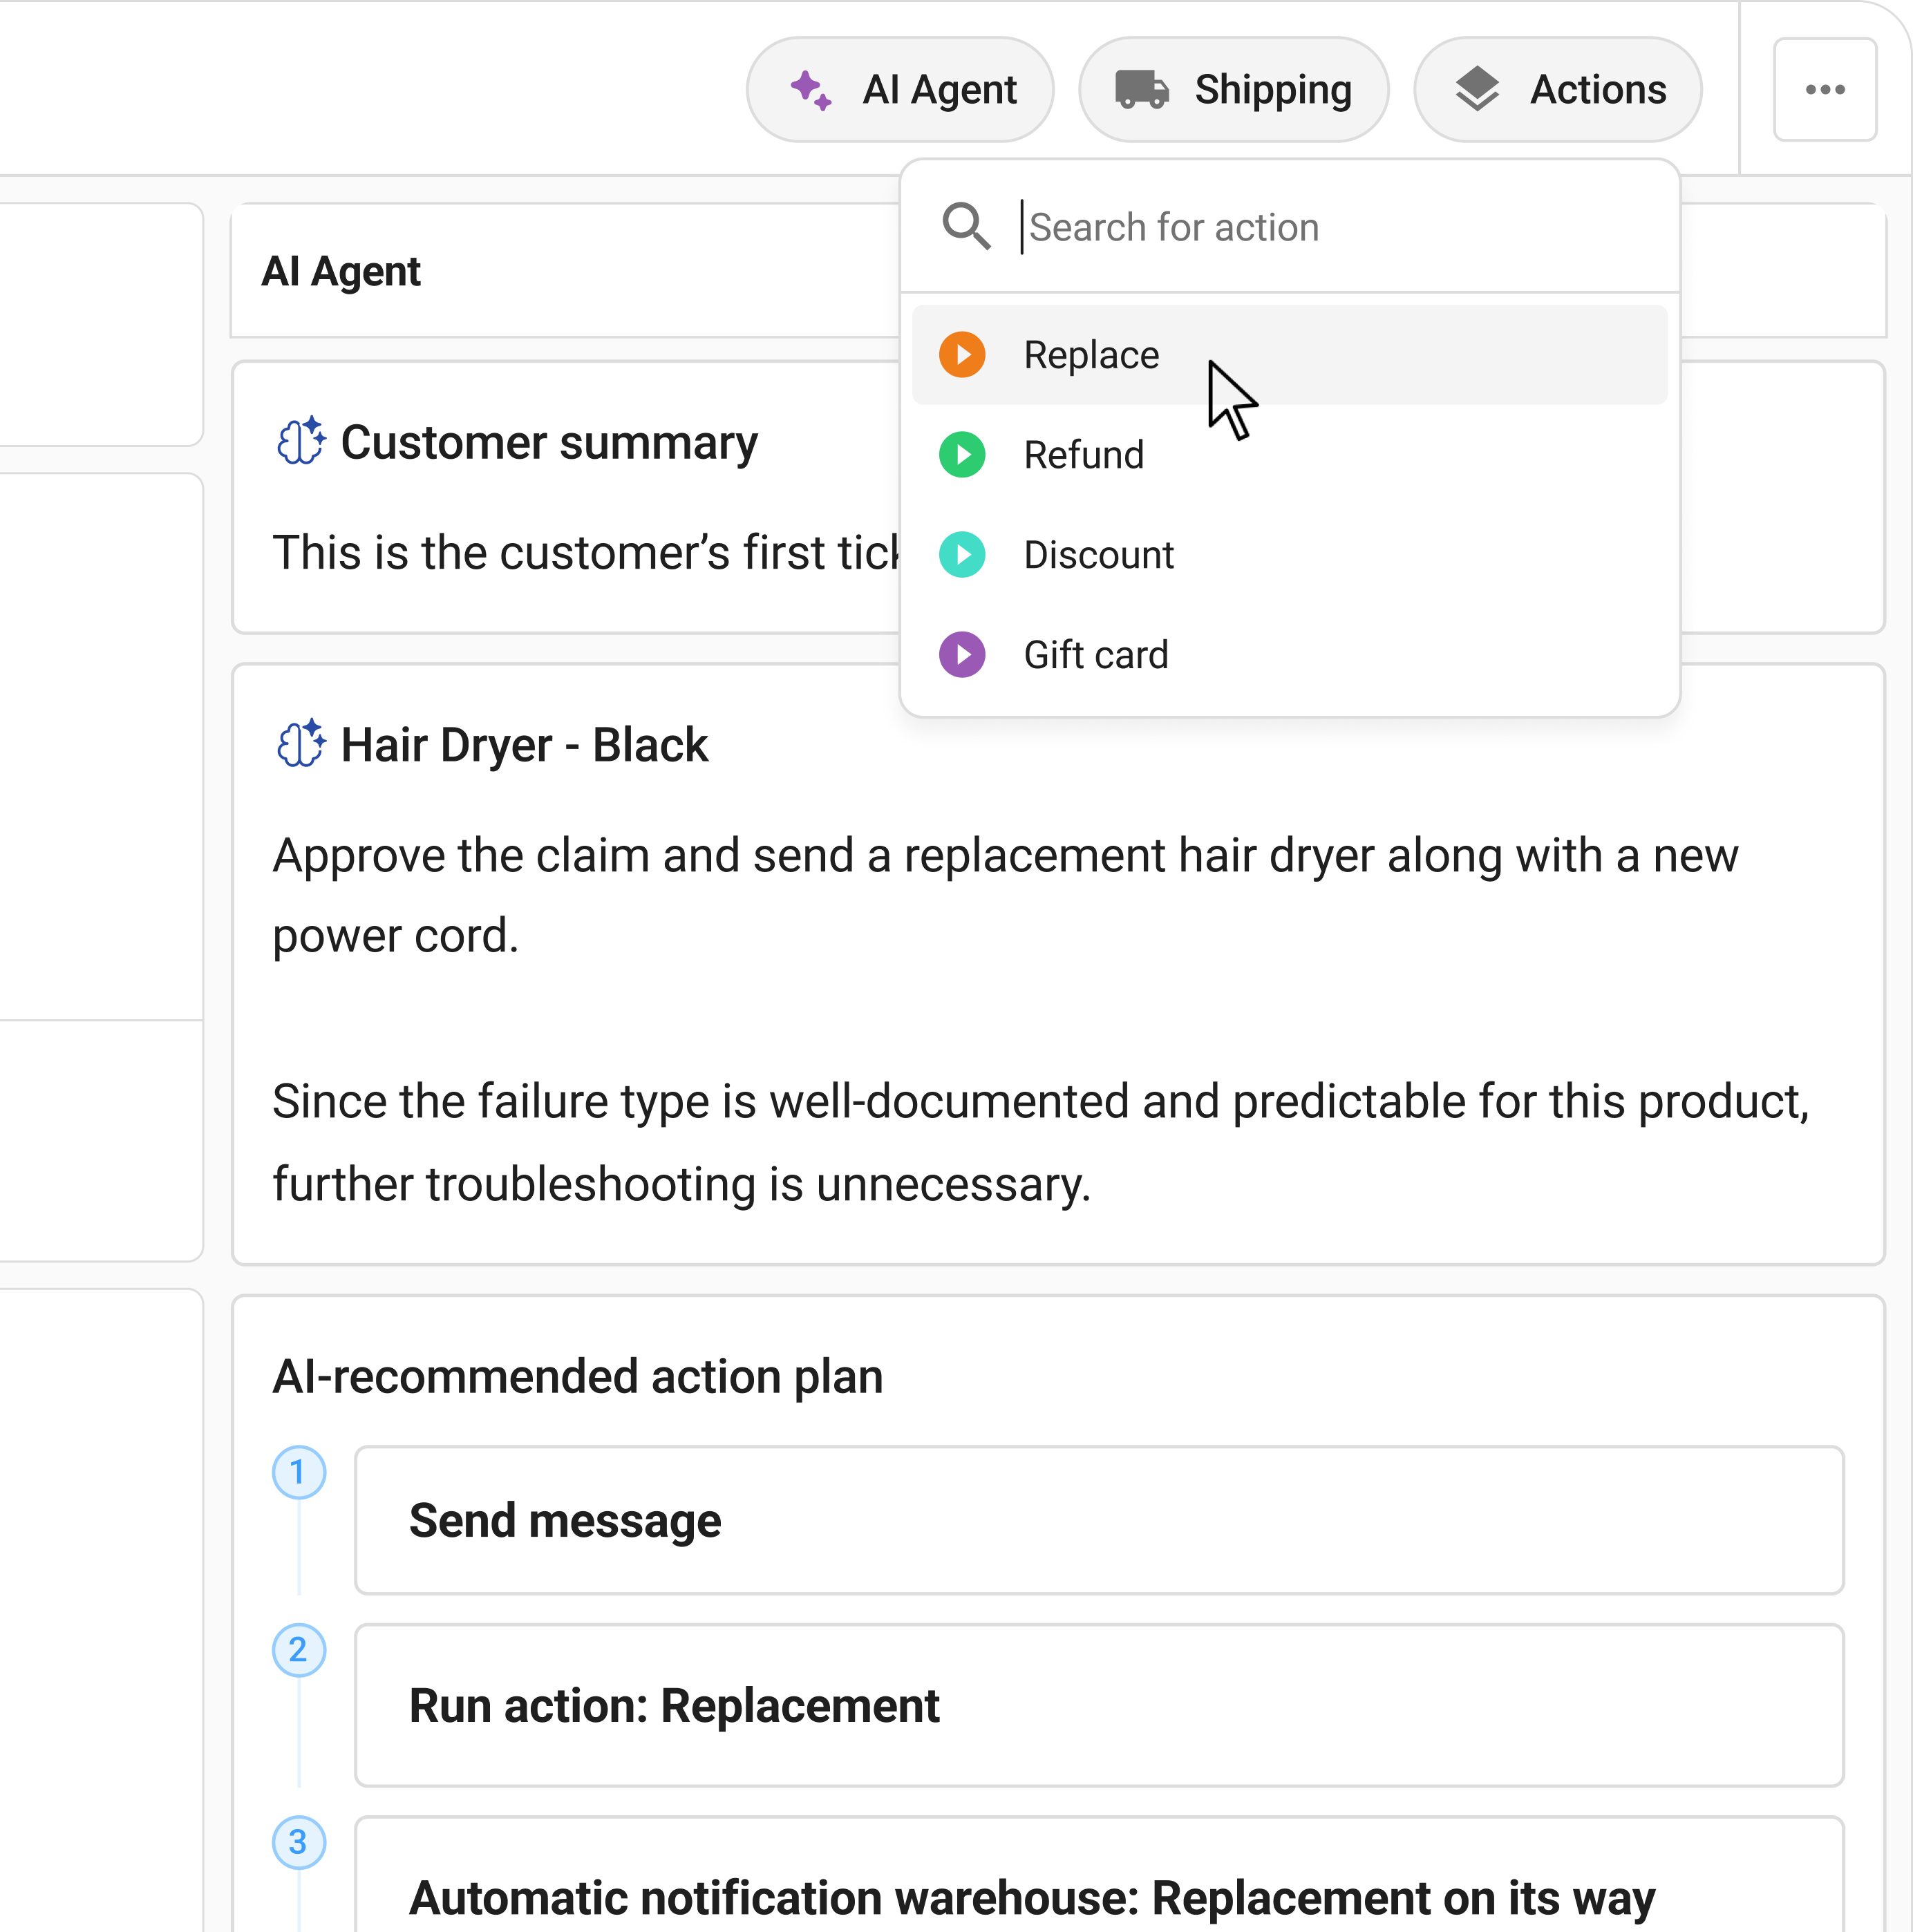
Claimlane's AI Agent, the first AI agent purpose-built for warranty claims and returns, helps reduce return costs by automating assessment, speeding up resolution, and capturing data that prevents future returns.
Claimlane is rated 4.8/5 on G2.
.webp)