
A high warranty claim rate quietly costs brands money in three places at once: in agent time per case, in supplier-recoverable amounts that don't get recovered, and in customers who don't come back after a bad experience. Roughly 20% of all returns are defect-driven, which means warranty claim rate has financial consequences far beyond what the support team sees.
This guide covers how to calculate warranty claim rate, why it climbs, and the operational shifts that actually bring it down. The advice is concrete: real numbers from documented customer outcomes, specific operational decisions, and the 2026 reality of AI handling parts of the workflow that previously needed trained agents.
How to calculate your warranty claim rate
The basic warranty claim rate formula is simple. Over a defined period (most brands use rolling 12 months), divide warranty claims by total orders.
The number itself only tells half the story. A 3% WCR for a fashion brand is alarming. A 3% WCR for a power tools brand is excellent. Benchmarks vary by category. What matters more is the trend: is your WCR climbing, flat, or declining month over month?
A guide on returns and warranty KPIs covers the broader metric set.
Why warranty claim rates climb
Before fixing the rate, understand what's driving it. Most warranty claim spikes trace back to one of four root causes.
The diagnostic question is which of these four is responsible for the current claim rate. The answer is usually some mix, with one dominant cause. Without structured claim data, brands can't tell which is which, so they fix the wrong things.
How to actually collect warranty claim data
Most warranty data sits in places that make analysis nearly impossible. The fix depends on the current state.
A platform like Claimlane standardises every case at intake (reason code, lifecycle stage, supplier ownership, photo evidence) so the data going into analytics is consistent enough to be useful. Without that consistency, the analytics built on top of inconsistent data tend to produce noise.
Operational shifts that move warranty claim rate
Six shifts that consistently lower warranty claim rate when applied in combination.
1. Use a warranty platform for claim handling
Manual warranty handling absorbs 10-45 minutes per case. At meaningful volume, that's a full headcount or more, plus inconsistent data, plus slow resolution times.
A warranty platform handles structured intake, automated routing, supplier handoffs, and analytics in one place. The benefits are practical: fewer errors, faster resolution, real visibility into trends.
A guide on warranty management software covers what to evaluate when comparing platforms.
2. Fix the products driving the claims
Once you know which SKUs are responsible for the highest claim volume (usually the top 10 SKUs drive 60-80% of claims under the Pareto principle), the fixes vary by root cause:
- Product quality issues: renegotiate with suppliers using the documented defect rate. Suppliers respond differently to "your defect rate is 3.2x category average" than to "we have quality problems."
- User error: rework the instructions, packaging, or product page. The fix is upstream of warranty.
- Shipping damage: test new packaging, switch carriers for fragile categories, or add pre-ship QC inspection.
- Manufacturing inconsistency: investigate the batch and date-of-manufacture data. Usually a temporary issue once the source is identified.
The deeper guide on warranty analytics for product quality covers the diagnostic process in more detail.
3. Improve customer support and communication
Customer support is on the front line of every warranty claim. A trained, well-tooled team handles cases faster, reduces follow-up volume, and turns warranty interactions into retention moments.
Three concrete actions:
A guide on how to reduce claim resolution time in customer service covers the operational side specifically.
4. Tune the warranty policy itself
Policies that are too lenient invite unnecessary claims. Policies that are too strict alienate customers and generate complaints. The right policy is calibrated to the category, the customer base, and the data on what's actually being claimed.
Three policy levers worth reviewing:
- Coverage scope: what's covered, what isn't, with examples. Vague terms like "normal wear and tear" cause more disputes than they prevent.
- Coverage period: category benchmarks vary widely (1 year for low-value goods, 5+ years for premium furniture). Match the period to product lifespan.
- Process consistency: standardise how cases are evaluated. Inconsistent decisions across agents fuel customer complaints and weaken supplier negotiations later.
For brands with multi-region operations, warranty registration helps automatically apply the right terms based on product, location, and customer type.
5. Use claim data to drive continuous improvement
Warranty data has a half-life. Cases from six months ago are useful for trend analysis. Cases from yesterday are useful for operational decisions. Both matter, but they get used differently.
The metrics worth tracking continuously:
- Claim frequency by SKU: the top 10 list, updated weekly
- Claim reasons by SKU: what defect types cluster on which products
- Resolution time per case: identifies which defect types or suppliers slow things down
- Product performance: SKUs with claim rates above 15% rarely make money on a fully-loaded basis
- Supplier defect rate: the single most useful number for quarterly supplier reviews
Brands running these reviews monthly catch quality issues before they compound. Brands running them quarterly catch the same issues a quarter later, having paid for them in the meantime.
6. Bring AI into the workflow (the 2026 shift)
The biggest shift in warranty operations this year is AI handling parts of a case that previously needed a trained agent.
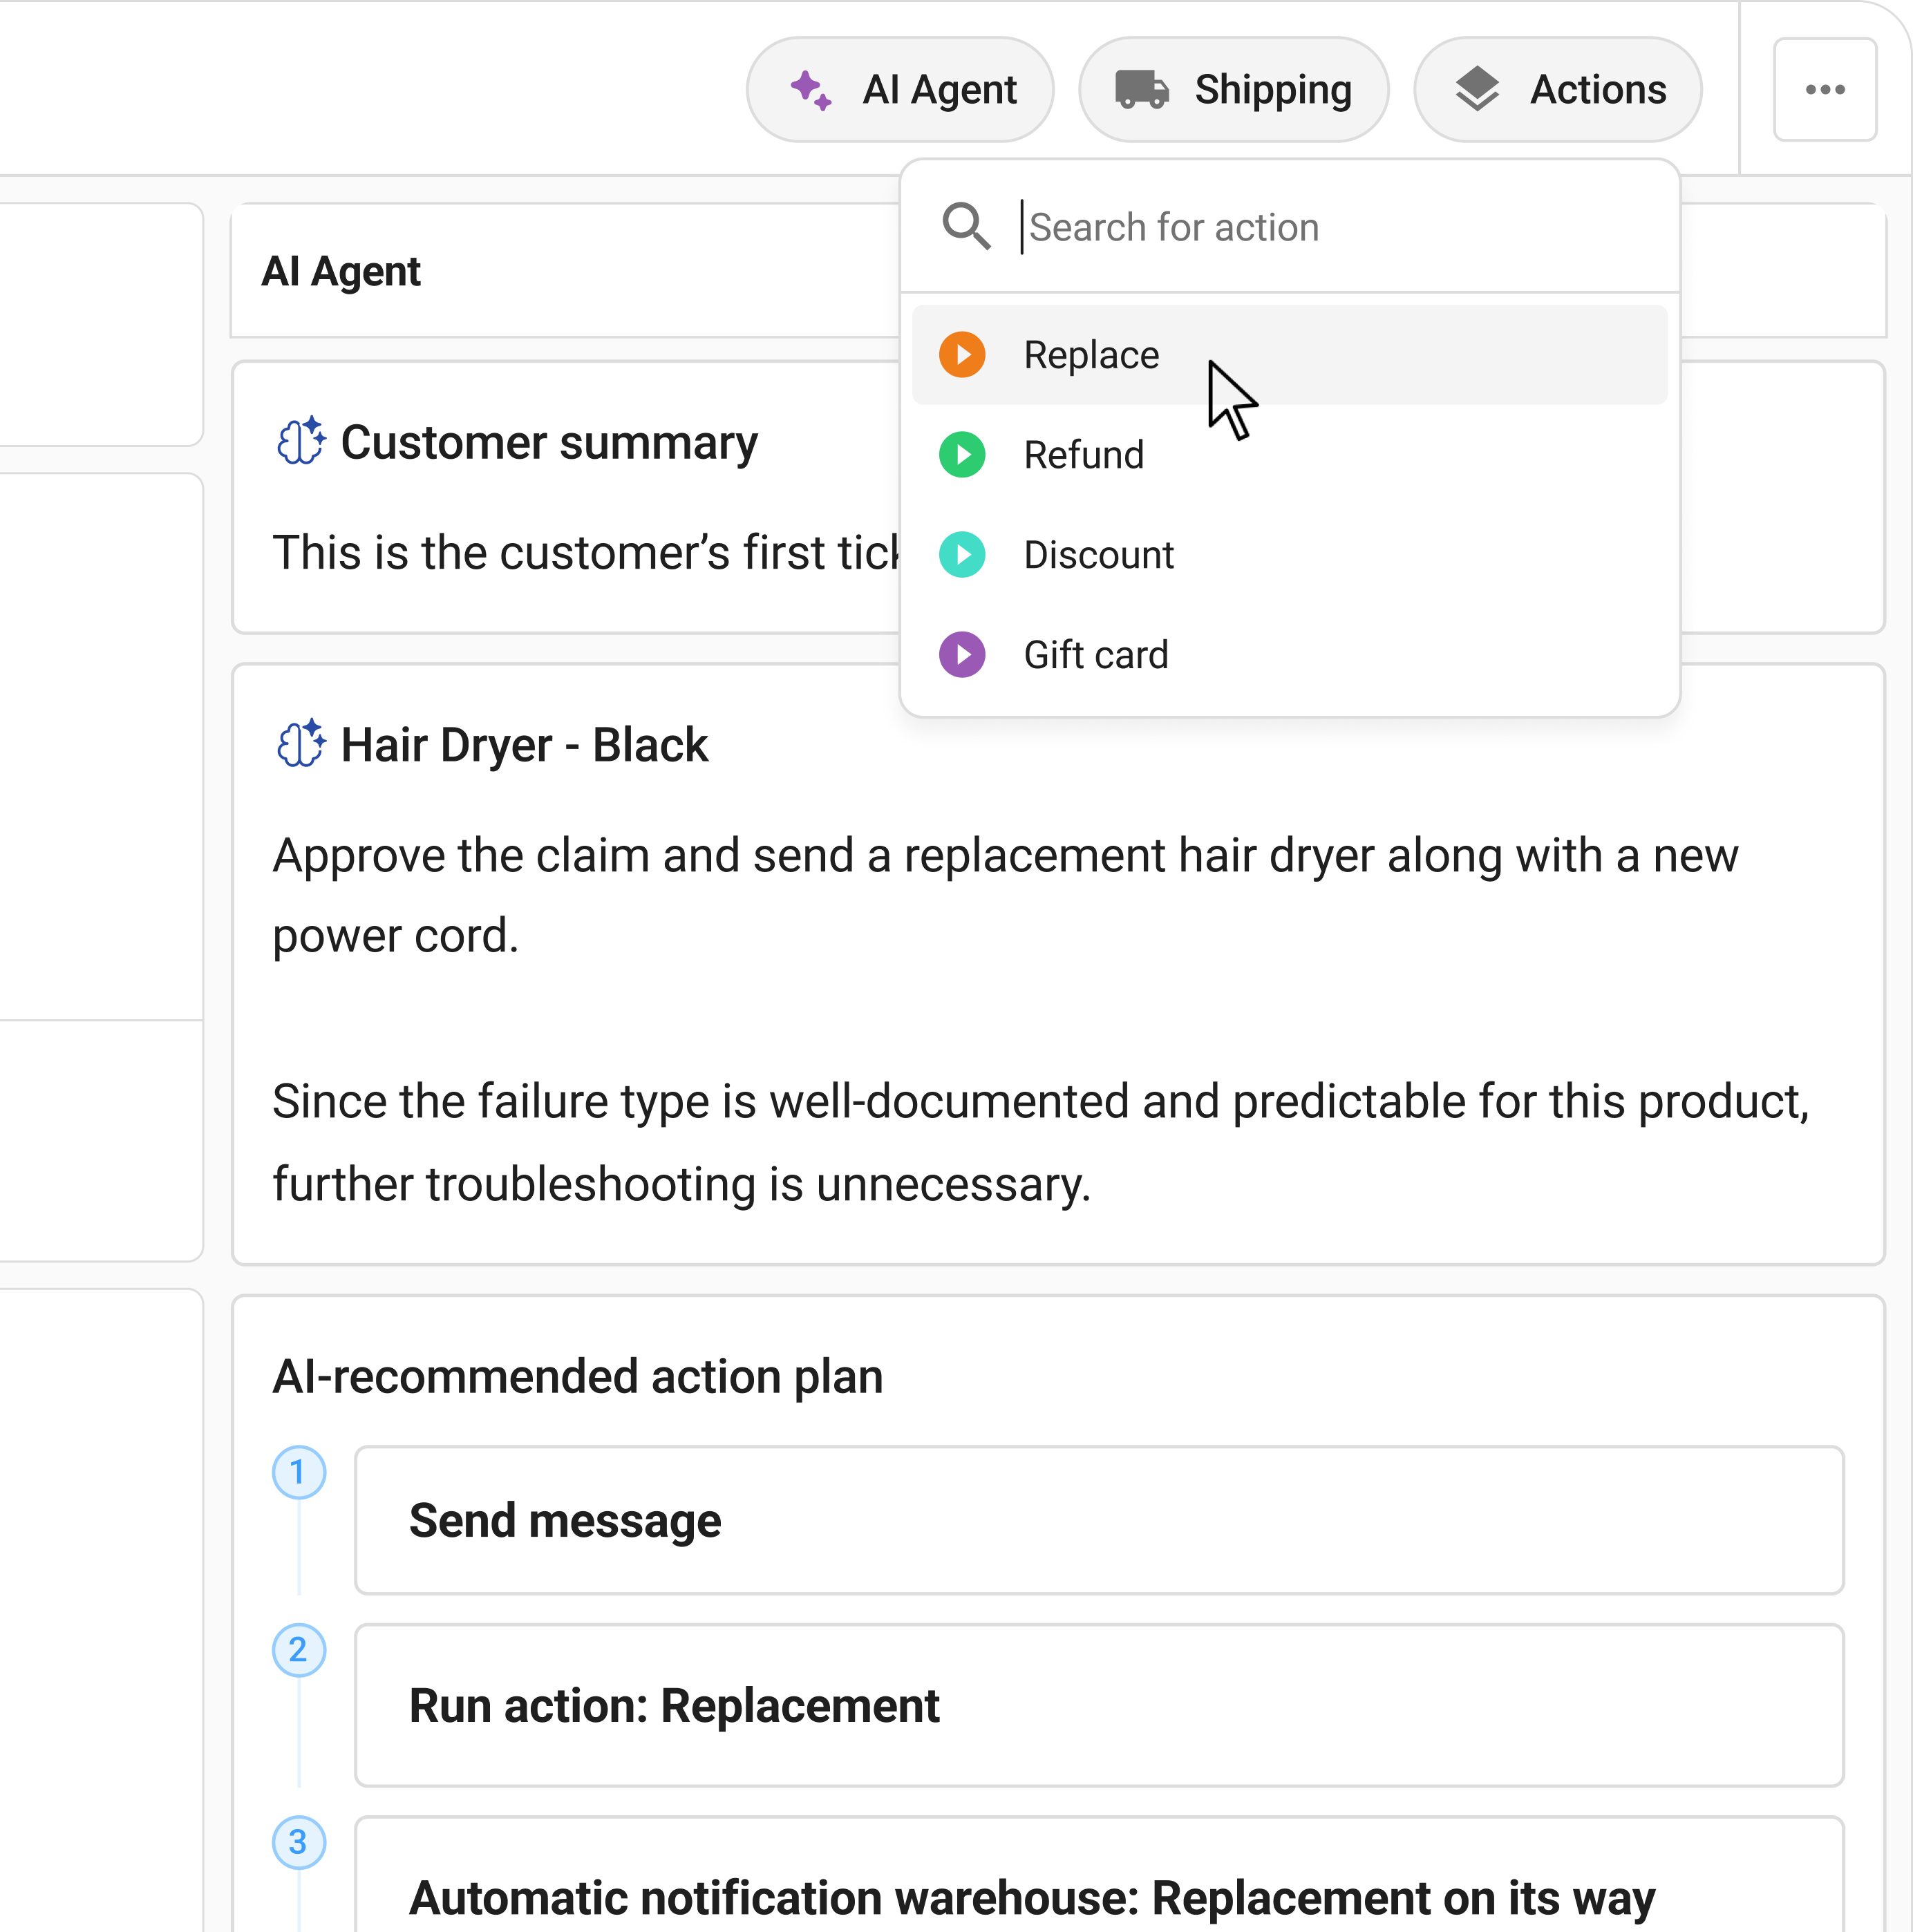
Claimlane's AI Agent, the first AI agent purpose-built for warranty claims and returns, reads photos and videos at intake, applies brand and supplier rules, classifies defects, and recommends or auto-resolves cases. The 10-45 minute case becomes a 30-second decision the agent confirms with one click.
For warranty claim rate specifically, the AI Agent helps in three ways:
- Faster resolution so customers get answers within minutes instead of days
- Consistent classification so the analytics built on top of claim data are actually reliable
- Pattern detection in real time so quality issues surface in week two, not week ten
What this looks like when it works
GrejFreak runs a multi-brand outdoor and electronics retail operation in the Nordic market. Their warranty operation hit the same wall most retailers carrying hundreds of brands eventually hit: each brand had different policies, agents couldn't memorise them all, and resolution times kept climbing.
After centralising warranty handling on Claimlane and applying the operational shifts in this guide, they saw the kind of result this article is built around.
GrejFreak is the most relevant proof point for this article because their starting profile (multi-brand, multi-supplier, complex warranty operation) matches what most readers come here researching. Other Claimlane customers with documented outcomes:
The pattern across all four customers (GrejFreak, Davidsen, Swoon, Onyx) is consistent: structured workflows, AI-assisted classification where it helps, and operational discipline applied to claim data. Same set of moves, different starting points, similar order of magnitude in outcomes.
Warranty claim rate is one of the highest-leverage metrics in post-sales operations. Lower it and the brand saves money on agent time, recovers more from suppliers, and keeps customers it would otherwise lose. The work isn't glamorous (structured intake, defect data, supplier accountability, monthly reviews) but it compounds. Claimlane handles the operational layer that makes consistent improvement possible. Book a demo to see what the same analysis would look like with your warranty data.
.webp)