.webp)
Online return rates have nearly tripled since 2019. The average ecommerce return rate now sits between 20% and 24%, depending on whose data you trust, with apparel pushing past 30% and some fashion segments hitting 50%. For most ecommerce brands, returns are no longer a back-office cost. They're a top-three operational expense and a top-three driver of customer retention.
This guide covers the current numbers (sourced, not invented), the cost of handling returns manually versus through structured systems, and what a working returns operation actually looks like in 2026.
How big is the ecommerce returns problem in 2026?
Three numbers tell the story.
Total volume. US merchandise returns hit $849.9 billion in 2025 according to the National Retail Federation, or roughly 15.8% of all retail sales. Online returns make up a large share of that, with online-specific rates running 2-3x higher than in-store.
Average ecommerce return rate. Capital One Shopping puts the 2026 average at 20.8%. The NRF reported 16.9% in 2024 and 20.4% in 2024 in different studies. Industry consensus is that the figure has crossed 20% and continues to climb.
Variance by category. Averages hide huge differences. Apparel sits at 20-30%, with some fashion segments at 50% during peak promotional periods. Beauty and skincare run 4-10%. Electronics and furniture sit in the middle but cost more per return.
For a deeper benchmark on what return rates mean for profitability, the returns-adjusted profitability guide for ecommerce breaks down the unit-economics math.
Why ecommerce return rates are so much higher than physical retail
Online return rates run 20-30%. Physical retail returns sit at around 8-9%. The gap isn't accidental.
Three structural causes drive it:
Buyers can't inspect the product. A customer who can touch the fabric, try on the shoe, or sit in the chair returns less often than one who only saw photos. This is the entire reason apparel and furniture run higher.
Bracketing is now standard behavior. Industry research suggests 63% of consumers buy multiple sizes or variants with the explicit plan to return what doesn't fit. Free returns enabled this. Brands can't easily un-enable it without losing conversion.
Sizing and fit issues cause ~45% of all returns. This is the single largest controllable cause across categories. Better size charts, better photos, AR try-on, size predictors, all reduce the rate.
The remaining 55% breaks down across damage in transit (~16%), inaccurate product descriptions (~14%), and a long tail of preference, change-of-mind, and quality issues. A guide on why customers return products covers the breakdown in detail.
The real cost of handling ecommerce returns
The return rate gets all the attention, but the cost per return is where margin actually leaks. Each return costs between $10 and $65 to process, depending on the category, the item, and the operational maturity of the brand handling it.
That cost includes:
- Reverse shipping (often free to the customer, paid by the brand)
- Inspection and grading at the warehouse
- Restocking, refurbishing, or disposal
- Customer service time on the case
- Refund processing
- Lost margin on items that can't be resold at full price
For a brand with $10M in annual revenue and a 20% return rate, that's roughly $1.7M in returned merchandise per year. At even a conservative $15 per return cost, that's $300K of pure operational expense before the lost-margin component is added.
The variable that brands actually control is the customer service handling and the warehouse-to-resolution time. Both compress sharply when the operation runs from a structured system instead of email and spreadsheets.
Where ecommerce returns operations break down
At low volume, email and spreadsheets work. At 50 returns a month, a small team handles everything by hand without much pain. The cracks appear somewhere between 200 and 500 monthly returns, and they're predictable.
These aren't theoretical. Every Claimlane customer described some version of this state before switching. The exact pattern varies by industry, but the structure of the breakdown is consistent.
What a working ecommerce returns operation looks like
Five operational mechanisms separate brands that handle returns at scale from brands that drown in them.
Each mechanism on its own makes a measurable difference. All five together are what separates a 8-day average resolution time from a 2-day one.
A guide on the best returns software for ecommerce covers the platform options. For brands building or evaluating their broader stack, the ecommerce technology stack complete guide places returns software in the wider context.
How AI changes the math on ecommerce returns
The biggest 2026 shift in returns operations isn't workflow software. It's AI that takes on the parts of a case that previously required a trained agent.
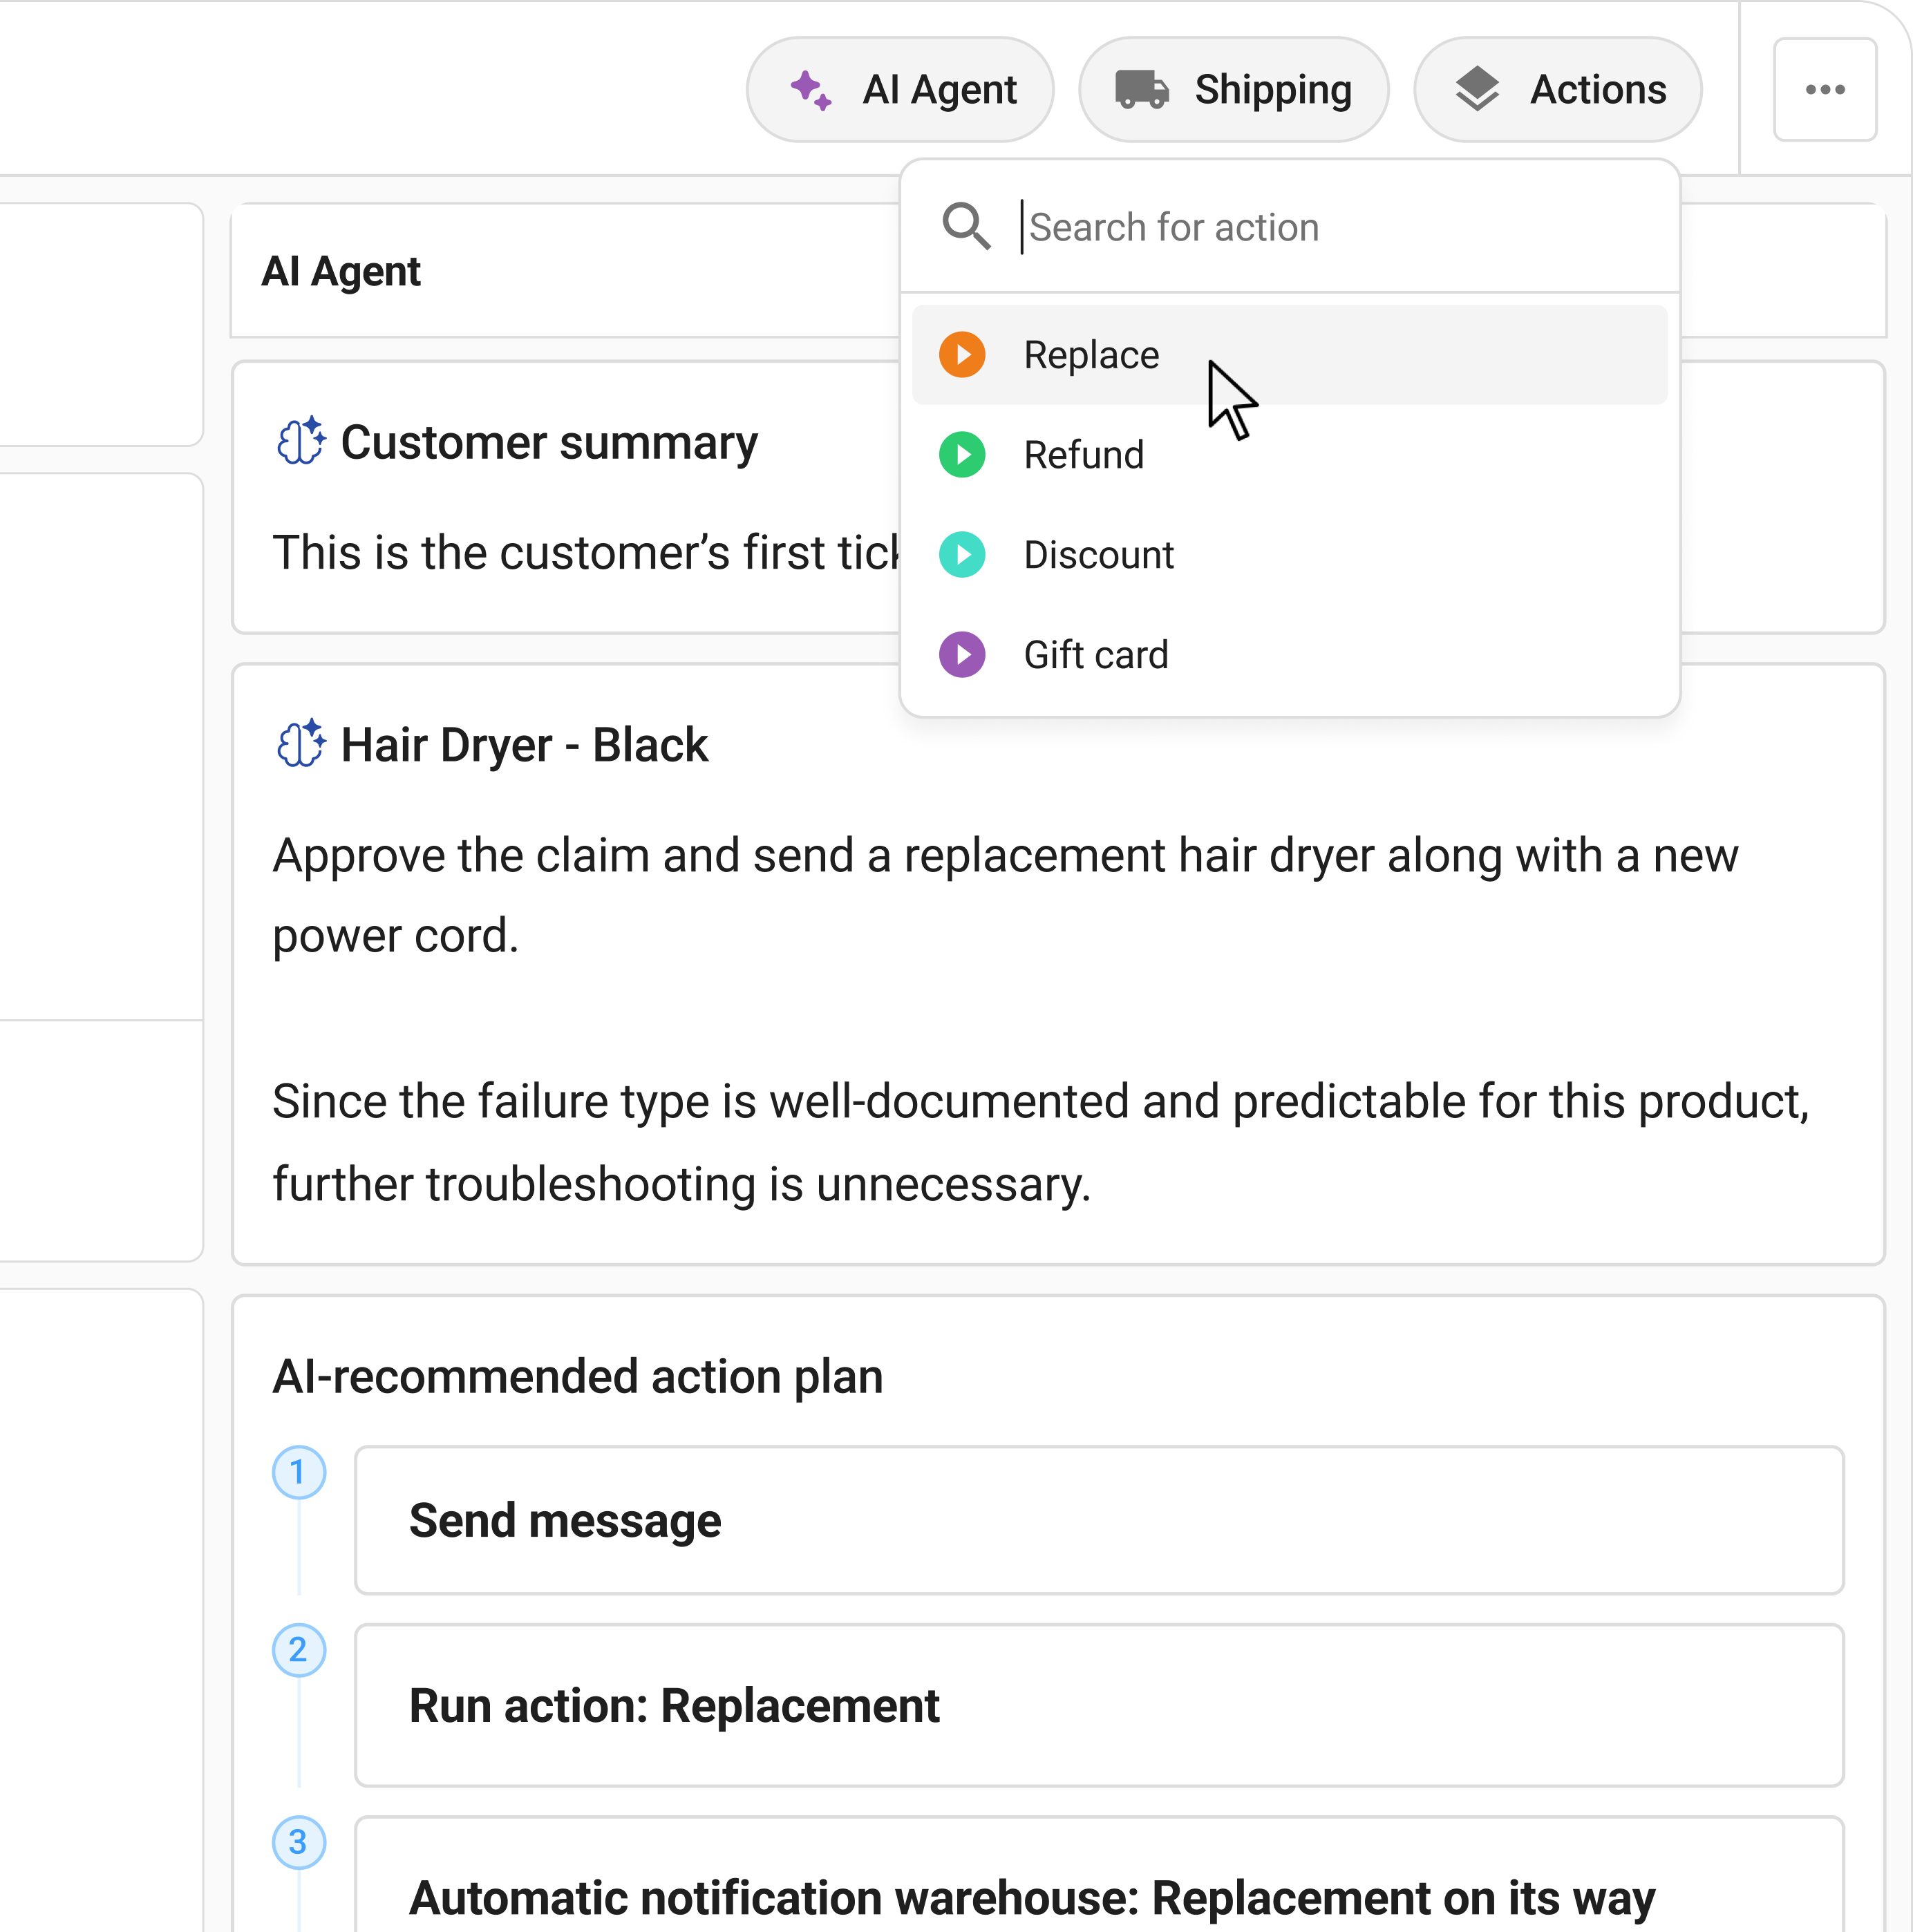
Claimlane's AI Agent, the first AI agent purpose-built for warranty claims and returns, reads customer-submitted photos and videos, classifies the issue, applies brand-specific and supplier-specific rules, and either auto-resolves the case or assembles it for human review. The cases that used to need 15-20 minutes of agent time collapse to seconds.
This is where the unit economics shift. A team handling 500 returns a month at 15 minutes per case is 125 hours of agent time. Half of those cases being AI-resolved drops that to 65 hours. The savings compound when supplier handoffs and inspection grading are also automated.
For brands handling 1,000+ returns per month, AI is the difference between scaling the team linearly with volume and scaling it sub-linearly. That gap compounds quickly.
The compound benefits of structured returns operations
Brands that move from email-based returns to structured systems consistently report the same pattern: agents stop spending most of their day collecting information and start spending it solving problems.
Three real customer outcomes show what this looks like in practice:
These aren't projections. They're documented customer outcomes. The patterns underneath them, fewer manual handoffs, structured supplier evidence, and ROI through recovered margin, apply across most ecommerce categories.
How returns become a competitive advantage
Returns and warranty experiences shape brand perception more than most marketing teams realise. Customers rarely remember a smooth 2-day delivery. They almost always remember a confusing or delayed return process.
The most useful framing: returns are the second-largest customer experience event after the purchase itself. The bar isn't "process the return correctly." It's "make the customer want to buy again after they had a problem."
Brands that handle returns well take three things seriously:
- Speed of resolution. Industry data suggests customers who get a fast, clean resolution buy again at higher rates than customers who didn't have a return at all.
- Transparency throughout. Status visibility from submission to refund, without the customer having to ask.
- Listening to the data. Returns are the most honest customer feedback channel a brand has. Brands that treat them as feedback (not just cost) catch quality issues earlier and improve products faster. The best customer feedback tools for ecommerce cover what to use to surface that signal.
For DTC brands specifically, post-purchase experience and customer loyalty goes deeper on the link between returns handling and repeat purchase rates.
Returns aren't going away. The brands that win in 2026 are the ones that treat returns as a strategic operation, not a cost center to minimise. Claimlane handles the full returns and warranty workflow from one platform: structured customer intake, automated routing, supplier handoffs, and an AI Agent that takes on the parts of a case that used to need a trained agent. Book a demo and see how a structured returns operation handles the patterns above on real cases.