
.webp)
Inventory shrinkage is the gap between what a retailer's records say should be on the shelves and what's actually there. It sounds like a small bookkeeping issue. It's not. Retail shrinkage hit $112.1 billion in losses in the US alone in recent years, according to the National Retail Federation.
For ecommerce and omnichannel brands, shrinkage doesn't just happen in the stockroom. It happens in fulfillment centers, during shipping, in the returns process, and through administrative errors that nobody catches until a quarterly audit. Understanding where inventory disappears and why is the first step toward stopping it.
This guide covers the main causes of inventory shrinkage, how to calculate shrink rate, and the operational strategies and tools that actually reduce it.
TL;DR
- Inventory shrinkage is the gap between recorded and actual inventory, costing US retailers over $112 billion. A shrink rate above 2% signals a problem needing immediate attention.
- Returns are a major shrinkage vector that most brands underestimate. Items get lost in transit, damaged, misrouted, or sit unprocessed until they become unsellable.
- Six main causes drive shrinkage: external theft (36%), employee theft (29%), admin errors, returns process leaks, vendor fraud, and damage/spoilage.
- Claimlane tracks every return from initiation through inspection and restocking, closing the loop that causes most returns-related shrinkage. Its AI Agent verifies product condition before approvals.
Inventory Shrinkage Defined
The Simple Formula
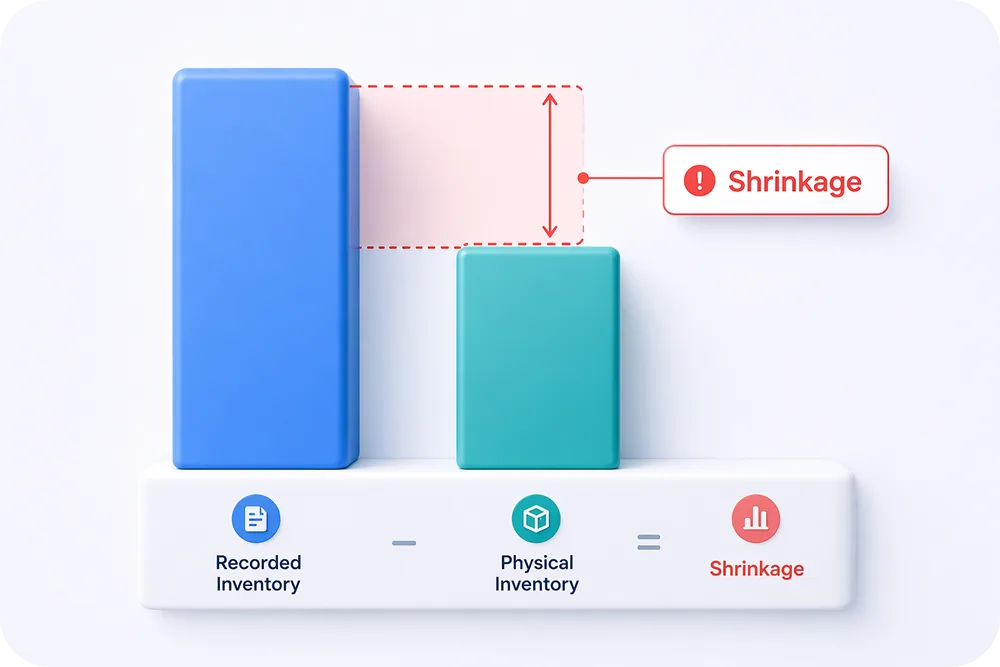
Inventory shrinkage is the difference between recorded inventory (what the system says) and physical inventory (what's actually counted). Expressed as a formula:
Shrinkage = Recorded Inventory - Physical Inventory
Shrink rate as a percentage:
Shrink Rate (%) = (Shrinkage Value / Recorded Inventory Value) x 100
A shrink rate of 1% to 2% is considered average in retail. Anything above 2% signals a problem that needs immediate attention. Some categories, particularly electronics and apparel, run higher.
minus Physical Inventory
x 100
Shrinkage vs Total Retail Loss
Shrinkage and total retail loss are related but not the same. Shrinkage covers unexpected losses: theft, errors, damage, fraud. Total retail loss also includes expected losses like markdowns, maintenance costs, and security spending. Once shrinkage is under control, brands can focus on those broader margin pressures.
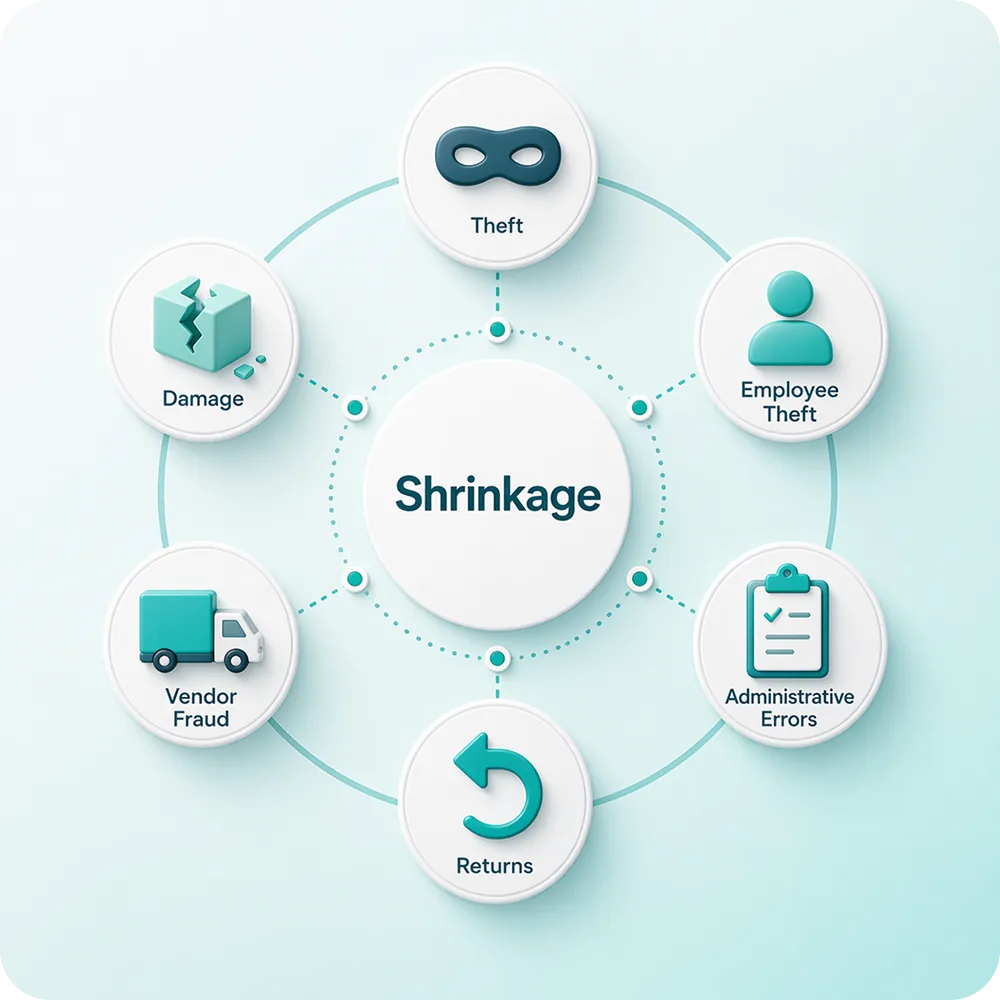
The Six Main Causes of Inventory Shrinkage
1. External Theft and Organized Retail Crime
Shoplifting and organized retail crime (ORC) are the largest single cause of shrinkage, accounting for roughly 36% of total shrink according to the NRF. ORC involves coordinated theft rings that steal merchandise at scale and resell it online or through fencing operations.
For ecommerce brands, external theft takes different forms: porch piracy (packages stolen after delivery), fraudulent delivery claims ("item not received" when it was), and return fraud schemes where customers return used, damaged, or counterfeit items for full refunds.
2. Employee Theft
Internal theft accounts for roughly 29% of shrinkage. It ranges from warehouse workers pocketing small items to more sophisticated schemes like manipulating inventory records, processing fake returns, or diverting shipments.
The challenge is detection. Employee theft often goes unnoticed for months because the people doing it understand the systems and know where the blind spots are.
3. Administrative and Process Errors
Miscounts during receiving, pricing mistakes, data entry errors, and inventory system sync failures all contribute to shrinkage. These aren't malicious, just messy. A single miscount during a warehouse transfer can cascade through the system and show up as "missing" inventory later.
For brands running omnichannel operations, keeping inventory counts accurate across a physical store, an ecommerce warehouse, and a 3PL fulfillment center is genuinely difficult.
4. Returns Process Shrinkage
Returns are a major shrinkage vector that many brands underestimate. Inventory gets lost in transit, arrives damaged, gets sorted incorrectly at the warehouse, or sits in a returns processing queue so long that it becomes unsellable.
Common returns-related shrinkage scenarios:
- Customer returns a used or different item than what they purchased
- Returned product gets damaged during shipping and can't be restocked
- Warehouse misroutes the return and it gets lost in receiving
- Item passes through returns processing but never gets added back to available inventory
Brands that track returns analytics closely can spot these leaks. The ones that don't are flying blind.
5. Vendor and Supplier Fraud
Suppliers shipping fewer units than invoiced, inflating prices, or delivering lower-quality products that get counted as full-value inventory all contribute to shrinkage. This is harder to catch because it requires matching receiving counts against purchase orders precisely.
6. Damage and Spoilage
Products get broken in the warehouse, expire on the shelf, or deteriorate during long storage periods. For categories like food, cosmetics, and seasonal goods, damage and spoilage can be a significant shrinkage driver.
How Inventory Shrinkage Affects Ecommerce Brands
The Financial Impact
Shrinkage directly reduces gross margin. If a brand has a 40% gross margin and a 2% shrink rate, that shrinkage eats 5% of the gross profit. For a brand doing $10M in revenue, that's $200,000 in lost inventory per year.
But the secondary effects are worse:
- Stockouts from phantom inventory: The system says 50 units are available, but only 35 exist. Orders get placed against non-existent stock, leading to cancellations, backorders, and unhappy customers.
- Inaccurate analytics: Inventory data feeds into demand forecasting, reorder points, and profitability calculations. Shrinkage corrupts all of them.
- Wasted marketing spend: Running ads for products that are technically "in stock" but physically missing wastes ad budget and damages brand trust.
With Claimlane, we can process the cases significantly faster than before, and at the same time, we get the right data per claim and thus valuable insight for improvement.
Benny Kristiansen, Former CSO — Sebra
The Returns-Shrinkage Connection
Returns and shrinkage are tightly linked. Every product that comes back is a chance for inventory to leak out of the system. The true cost of returns isn't just the refund amount. It includes the shrinkage that happens during return processing.
Brands that treat returns as a separate process from inventory management tend to have higher shrinkage rates. The fix is connecting the returns workflow to the inventory system so that every return is tracked from initiation through inspection, restocking (or disposal), and inventory adjustment.
That's exactly what platforms like Claimlane do: every claim and return is tracked through a complete workflow, with data feeding into analytics that show where losses are happening. Rated 4.8/5 on G2 (read reviews), Claimlane gives brands full visibility into every step of the returns lifecycle.
How to Calculate Your Shrink Rate
Step-by-Step Calculation
- Count physical inventory. Do a full physical count or cycle count of all stock.
- Pull recorded inventory. Export the current inventory values from the ERP or inventory management system.
- Calculate the difference. Subtract physical count from recorded count. This is the shrinkage amount.
- Calculate the percentage. Divide shrinkage value by recorded inventory value, multiply by 100.
Example: A brand's system shows $500,000 in inventory. Physical count reveals $485,000. Shrinkage = $15,000. Shrink rate = ($15,000 / $500,000) x 100 = 3.0% (above the 2% alarm threshold).
How Often to Count
- Full physical counts: At least annually, ideally semi-annually for high-value categories.
- Cycle counts: Weekly or bi-weekly, rotating through different product categories. This catches problems faster than waiting for the annual count.
- Perpetual inventory systems: Real-time tracking through barcode/RFID scanning at every touchpoint (receiving, shelving, picking, shipping, returns). This is the gold standard but requires technology investment.
Proven Strategies to Reduce Inventory Shrinkage
Tighten the Returns Process
Since returns are a major shrinkage vector, fixing the returns process has outsized impact:
- Require photo evidence for all claims. Customers upload photos when requesting a return. This reduces fraudulent returns and gives the warehouse team advance information about product condition. Claimlane's self-service portal makes this standard.
- Inspect every return on arrival. Don't just restock returns blindly. Inspect condition, verify the correct product was returned, and check serial numbers where applicable.
- Track returns end-to-end. From the moment a return is initiated to the moment the item is restocked or disposed, every step should be logged. This is where returns management platforms earn their keep.
- Identify serial returners. Customers who consistently return items at high rates may be engaging in wardrobing or other abuse patterns.
- Require photo evidence for every return or warranty claim
- Inspect and verify every returned item before restocking
- Track items from return initiation through restocking or disposal
- Flag serial returners and review their patterns monthly
- Match returned items against original order data (SKU, serial number)
Improve Warehouse Operations
Many warehouse challenges contribute directly to shrinkage:
- Barcode scan at every touchpoint. Receiving, putaway, picking, packing, shipping, and returns. Every movement gets logged.
- Implement cycle counting. Regular partial counts catch discrepancies before they compound.
- Separate the returns processing area. Returned items should have their own zone with dedicated staff and protocols. Mixing returns into general receiving increases errors.
- Use inventory management software. Manual spreadsheets can't keep up with ecommerce velocity. A system integrated with the ecommerce platform and returns workflow reduces administrative errors.
Use Data and Analytics to Spot Patterns
Shrinkage is rarely random. It follows patterns: specific products go missing more often, certain shifts have higher loss rates, particular suppliers consistently short-ship.
Brands using analytics tools can identify:
- Products with the highest shrink rates (and investigate why)
- Correlation between return rates and inventory discrepancies
- Supplier accuracy rates (units received vs units invoiced)
- Seasonal patterns in shrinkage
Predictive analytics takes this further by flagging anomalies before they become significant losses.
Reduce Return-Related Fraud
Return fraud is a subset of shrinkage that's growing fast. Common tactics include:
- Returning a cheaper item in the packaging of the purchased product
- Claiming non-delivery of packages that were actually received
- Wardrobing (buying, using, and returning items)
- Using stolen credit cards to buy products and returning for cash/store credit
Platforms like Claimlane help by requiring photo and video documentation with every claim, applying rules per product and supplier, and flagging unusual patterns. The AI Agent can analyze submitted images to verify product condition and identity before a return is even approved.
Strengthen Vendor Management
Verify every inbound shipment against the purchase order. Count units, check product conditions, and document discrepancies immediately. For brands using multiple suppliers, forwarding claims to suppliers when products arrive defective or short-shipped helps recover costs and hold vendors accountable.
Technology That Helps Prevent Shrinkage
Inventory Management Systems
A modern inventory management system is the foundation. It needs to:
- Sync inventory across all channels (DTC site, marketplace, retail) in real time
- Support barcode/RFID scanning
- Integrate with the returns workflow
- Generate shrinkage reports by category, location, and time period
Returns Management Platforms
A dedicated returns platform reduces shrinkage by:
- Capturing return reason data and photo evidence at initiation
- Tracking every returned item through the full lifecycle
- Connecting return data to inventory adjustments automatically
- Flagging anomalies (e.g., return rate spikes on specific SKUs)
Claimlane does this while also handling warranty claims, repairs, and supplier recoveries in the same system. That gives brands a complete view of after-sales operations and where inventory is leaking.
RFID and Smart Tracking
RFID tags on individual items enable real-time location tracking throughout the supply chain. When an item enters the warehouse, moves to a shelf, gets picked for an order, or comes back as a return, the RFID tag logs every movement. This eliminates the "we don't know where it went" problem that causes most administrative shrinkage.
Inventory Shrinkage Benchmarks by Category
Not all categories shrink equally. Some benchmarks from industry data:
| Category | Typical Shrink Rate | Primary Cause |
|---|---|---|
| Apparel | 1.5% - 3.0% | Returns fraud, wardrobing |
| Electronics | 1.5% - 2.5% | Theft, damage |
| Grocery / Food | 2.0% - 4.0% | Spoilage, theft |
| Home / Furniture | 1.0% - 2.0% | Shipping damage, admin errors |
| Health / Beauty | 1.5% - 3.0% | Theft (small, high-value items) |
| Sporting Goods | 1.0% - 2.0% | Damage, returns |
For furniture brands, the shrinkage rate is lower percentage-wise but the dollar value per incident is much higher because of the item cost. A single missing sofa represents more loss than dozens of missing t-shirts.
.webp)

