
.webp)
Data drives every decision in ecommerce. Which products to stock, which channels to invest in, which customer segments to target, and which operational bottlenecks to fix. But data only works if the analytics tools are capturing the right metrics, presenting them in an actionable way, and integrating with the rest of the technology stack.
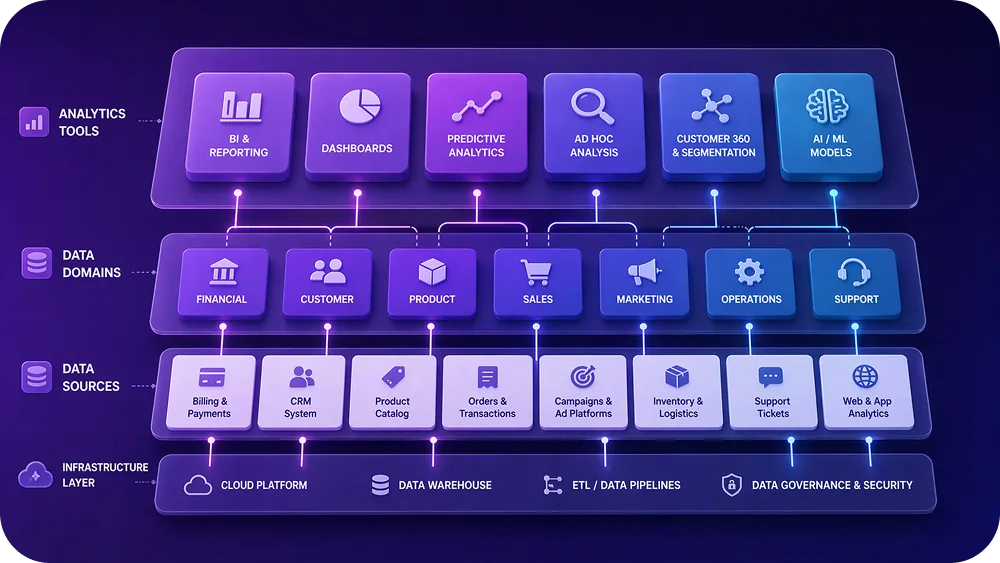
The ecommerce analytics landscape in 2026 is more fragmented than ever. No single platform covers everything. Web analytics, sales tracking, marketing attribution, inventory optimization, customer behavior analysis, and returns analytics each require specialized tools. The brands getting the best results are the ones combining the right platforms for each data domain.
This guide reviews the best ecommerce analytics platforms across every category, with honest assessments of what each tool does well, where it falls short, and which brands each tool is best suited for.
TL;DR
- No single analytics platform covers everything. The best brands combine 3–5 tools across web analytics, marketing attribution, sales tracking, customer behavior, and returns analytics.
- Returns analytics is the most overlooked category, yet returns affect 15–30% of orders. Without dedicated returns analytics, brands can't identify problematic products or costly suppliers.
- AI adds real value in anomaly detection and predictive analytics, but many "AI-powered" dashboards are just marketing labels on standard charts.
- Claimlane fills the post-purchase analytics gap by tracking return rates, reasons, cost per return, warranty patterns, and supplier defect rates that other analytics platforms ignore.
How to Evaluate Ecommerce Analytics Platforms
The Five Criteria That Matter
Before comparing platforms, here's what to evaluate:
- Data accuracy: How reliable are the numbers? Does the platform handle cookie consent, ad blockers, and cross-device tracking well?
- Integration depth: Does it pull data from the ecommerce platform, marketing tools, and operational systems?
- Actionability: Does it surface insights that lead to specific actions, or just dashboards of numbers?
- Cost vs value: Is the pricing appropriate for the brand's size and the value delivered?
- AI capabilities: Does the platform use AI for anomaly detection, predictions, or automated insights?
Web Analytics Platforms
Google Analytics 4 (GA4)
Best for: Universal web analytics baseline
GA4 is the default web analytics platform and the only free option with meaningful depth. It handles traffic analysis, user behavior, conversion tracking, and basic ecommerce reporting.
Strengths:
- Free for most usage levels
- Strong integration with Google Ads
- Event-based data model is more flexible than the old session-based approach
- BigQuery export for custom analysis
Weaknesses:
- Steep learning curve (the interface is not intuitive)
- Data sampling at higher volumes (paid GA360 removes this)
- Limited real-time accuracy
- Privacy regulations and ad blockers reduce data completeness
Pricing: Free (GA360 starts at ~$50K/year)
Mixpanel
Best for: Product and conversion funnel analysis
Mixpanel excels at understanding user behavior within the store: how customers navigate, where they drop off, which features drive engagement.
Strengths:
- Best-in-class funnel and retention analysis
- Powerful segmentation
- Real-time data
- More intuitive than GA4 for behavioral analysis
Weaknesses:
- Expensive at scale (event-based pricing adds up)
- Less comprehensive for traffic source analysis
- Requires more implementation effort than GA4
Pricing: Free tier, paid from $20/month, scales with events
Amplitude
Best for: Enterprise product analytics with AI
Amplitude is Mixpanel's enterprise competitor. Stronger AI features, better collaboration tools, and more robust data governance.
Strengths:
- AI-powered anomaly detection and insight generation
- Strong cohort analysis
- Good for A/B testing analysis
- Enterprise-grade data governance
Weaknesses:
- Expensive
- Overkill for small to mid-market brands
- Complex setup
Pricing: Free tier, enterprise pricing on request
Marketing Attribution and Ad Analytics
Triple Whale
Best for: DTC Shopify brands needing ad attribution
Triple Whale has become the go-to attribution platform for Shopify brands. It connects ad spend across channels (Meta, Google, TikTok) and ties it to actual revenue.
Strengths:
- First-party data attribution (less affected by iOS privacy changes)
- Clean dashboard showing ROAS, CAC, and LTV across channels
- Shopify-native integration
- AI features for spend optimization recommendations
Weaknesses:
- Primarily Shopify-focused
- Attribution models are imperfect (all attribution tools have this limitation)
- Gets expensive at higher revenue levels
Pricing: From $100/month, scales with revenue
Northbeam
Best for: Multi-channel attribution for growth brands
Northbeam uses machine learning to build attribution models that account for the full customer journey across channels.
Strengths:
- Multi-touch attribution across channels
- Media mix modeling for budget allocation
- Works with any ecommerce platform
- Strong for brands spending $50K+/month on ads
Weaknesses:
- Expensive (enterprise pricing)
- Requires significant ad spend to justify the cost
- Setup can be complex
Pricing: Custom pricing (typically $500+/month)
Sales and Revenue Analytics
Platform Native Dashboards
Shopify, BigCommerce, and WooCommerce all include built-in sales analytics. For many brands, these are sufficient for basic revenue tracking.
Shopify Analytics is the best of the bunch: clean interface, real-time data, good product-level reporting. Shopify Plus adds more advanced reporting.
When platform dashboards aren't enough:
- Multi-channel selling (marketplace + website + wholesale)
- Need to combine sales data with marketing, inventory, and returns data
- Custom reporting requirements beyond what the platform offers
Looker / Looker Studio
Best for: Custom dashboards combining multiple data sources
Looker (Google's BI platform) and Looker Studio (the free version) let brands build custom dashboards pulling from multiple sources.
Strengths:
- Connects to almost any data source
- Highly customizable
- Free version (Looker Studio) is surprisingly capable
- Good for executive dashboards
Weaknesses:
- Requires SQL or data modeling knowledge for advanced use
- Looker (full version) is expensive
- Not purpose-built for ecommerce
Returns and After-Sales Analytics
Claimlane
Best for: Returns, warranty, and claims analytics
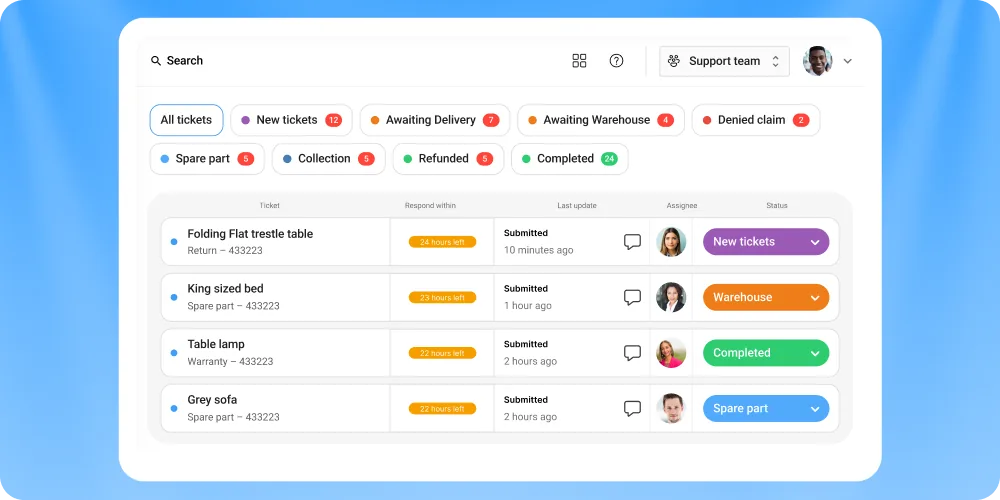
Most ecommerce analytics platforms ignore post-purchase data. Claimlane's analytics fill this gap by tracking the full returns lifecycle.
What Claimlane tracks:
- Return rates by product, category, and customer segment
- Return reasons and trends over time
- Cost per return (including shipping, processing, and lost value)
- Warranty claim patterns and supplier defect rates
- Resolution time and customer satisfaction
- Serial returner identification
- Supplier performance on forwarded claims
Why returns analytics matter:
Returns affect 15% to 30% of ecommerce orders. Without dedicated analytics, brands can't answer basic questions like: Which products have the highest return rates and why? How much are returns costing per quarter? Which suppliers produce the most defective products? Is the AI automation working effectively?
Claimlane integrates with the ecommerce platform and the rest of the stack, so returns data can be combined with sales, marketing, and customer data for a complete picture. Rated 4.8/5 on G2 (read reviews), Claimlane is the go-to platform for post-purchase analytics.
Pricing: Based on claim volume, contact for pricing
Claimlane's Self-Service Portal has revolutionized how our customers submit their requests and eliminated the need for phone calls and email exchanges.
Adnan Baessa, Head of Operations — Cult
Customer Analytics
Klaviyo
Best for: Email/SMS marketing analytics with customer segmentation
Klaviyo is technically an email/SMS marketing platform, but its analytics capabilities are strong enough to serve as the primary customer analytics tool for many ecommerce brands.
Key analytics features:
- Customer lifetime value (CLV/LTV) tracking
- Cohort analysis by acquisition source
- Predictive analytics for churn risk and next purchase date
- Revenue attribution for email/SMS campaigns
- RFM (recency, frequency, monetary) segmentation
Customer Data Platforms (CDPs)
For brands needing unified customer profiles across all channels, a CDP like Segment or mParticle consolidates data from every touchpoint.
Best for: Brands with complex multi-channel customer journeys who need a single source of truth for customer data.
Comparison Table: Best Ecommerce Analytics Platforms
| Platform | Best For | Key Strength | Price |
|---|---|---|---|
| GA4 | Web baseline | Free, universal | Free |
| Mixpanel | Funnels | Best behavior analysis | Free/$20 |
| Amplitude | Enterprise | AI insights | Free/custom |
| Triple Whale | DTC attribution | First-party data | $100/mo |
| Northbeam | Multi-channel | ML attribution | $500+/mo |
| Looker Studio | Custom dashboards | Free, flexible | Free |
| Claimlane | Returns + claims | Post-purchase data | Contact |
| Klaviyo | Customer + email | LTV, predictive AI | Free/$20 |
Building Your Analytics Stack
The Minimum Viable Analytics Stack
For most ecommerce brands, start with:
- GA4 for web analytics (free)
- Platform dashboards for sales data (included)
- Klaviyo for customer and email analytics ($20+/month)
- Claimlane for returns analytics (contact for pricing)
- Triple Whale or similar for ad attribution once spending $5K+/month on ads
This covers the core data needs without overcomplicating the stack.
Connecting the Dots
The real value comes from combining data across platforms:
- Sales + returns data reveals true product profitability (a product with high sales but a 30% return rate might be losing money)
- Marketing + customer analytics shows which acquisition channels produce the highest LTV customers (not just the most customers)
- Returns + customer data identifies which customer segments have the highest return rates and why
- Product + returns analytics tells the product team which items need design improvements, better descriptions, or sizing adjustments
Managing warranty claims and repairs across such a wide range of products used to be messy. Claimlane gives us a setup that keeps everything organized and easy to handle. It helps us respond faster and deliver the level of service our customers expect from us.
Tess Jordan, Senior Manager of Customer Experience — Black Diamond
AI in Ecommerce Analytics: What's Real vs Hype
Real AI Value
- Anomaly detection: AI that flags unusual patterns (sudden spike in return rates, unexpected drop in conversion) before a human notices
- Predictive analytics: Forecasting demand, churn risk, and return likelihood based on historical patterns
- Natural language queries: Asking questions in plain English ("What were our top-returning products last month?") instead of building reports manually
- Automated insights: AI that proactively surfaces insights ("Return rates for Category X increased 15% this week, primarily driven by sizing issues")
Overhyped AI Features
- "AI-powered" dashboards that are just pre-built charts with a marketing label
- Predictions with insufficient data (AI needs volume to predict accurately)
- Automated actions without human oversight (AI should recommend, humans should decide)
.webp)

