
.webp)
Most supplier quality problems do not start as surprises. They start as patterns buried in return data, inspection logs, and warranty claims that nobody connects. Quality issue reporting changes that. It gives operations teams a structured way to document defects, trace them to root causes, and hold suppliers accountable with measurable corrective actions.
This guide covers the full workflow: nonconformance reporting, CAPA processes, supplier scorecards, and audit cycles. Together they turn quality issues into lasting supplier improvement.
TL;DR
- Quality issue reporting is the structured process of documenting defects, tracing root causes through NCRs and CAPA, and tracking supplier corrective actions.
- Effective CAPA reduces repeat defect rates by 15–25% when tied to scorecards with real business consequences.
- Traditional NCR workflows via email lose evidence, miss deadlines, and lack audit trails. Platform-based supplier forwarding solves all three.
- Claimlane connects the full chain from customer defect evidence to supplier corrective actions, with AI classification and built-in analytics.
What Is Quality Issue Reporting?
The Core Concept
Quality issue reporting is the process of documenting, classifying, and communicating product defects or process gaps to the responsible party, usually a supplier. It goes beyond simply noting that something went wrong. A proper quality issue report includes:
- What failed: Specific defect description with photos or videos.
- How many: Volume of affected units, batch numbers, date range.
- Why it matters: Impact on customers, cost to the business, regulatory implications.
- What needs to happen: Corrective action request with a deadline.
Without structured reporting, quality conversations with suppliers turn into vague emails and finger-pointing. With it, every defect becomes a data point that drives measurable improvement.
Where Quality Issues Come From
Quality issues surface through multiple channels:
- Incoming inspections at the warehouse or distribution center.
- Customer returns with defect-related reason codes.
- Warranty claims filed after product failure during use.
- Internal audits of supplier processes and facilities.
- Field service reports from repair technicians.
Each channel captures a different slice of the quality picture. The challenge is bringing them together into a single reporting framework that suppliers can act on. Platforms like Claimlane combine returns, warranty claims, and supplier communication into one system. Defect data from every channel feeds into the same quality reports.
Nonconformance Reporting: The Foundation
What Is a Nonconformance Report (NCR)?
A nonconformance report documents any case where a product, material, or process misses spec. In supplier quality management, the NCR is the formal record that a supplier's delivery failed to meet agreed standards.
An effective NCR includes:
- NCR number and date for tracking.
- Supplier name and ID.
- Product/SKU and batch or lot number.
- Defect description with category and severity (Critical, Major, Minor).
- Evidence: Photos, inspection measurements, customer complaints.
- Quantity affected and quantity inspected.
- Immediate disposition: Return to supplier, rework, use-as-is, or scrap.
- Root cause analysis request with deadline.
NCR Severity Levels
From NCR to Action
Filing an NCR is only the first step. The report must reach the supplier with enough context to act on. That means attaching the evidence (not just describing it), specifying the batch, and stating the expected corrective action timeline.
Many quality teams still send NCRs via email with spreadsheet attachments. The problem: emails get lost, attachments get detached, and there is no audit trail for response times. Forwarding claims through a structured platform ensures the NCR reaches the right person. Evidence stays intact. The deadline is trackable.
Corrective and Preventive Actions (CAPA)
What Is CAPA?
Corrective and Preventive Action (CAPA) is the process for investigating the root cause of a quality issue, fixing it, and preventing it from happening again. In supplier quality management, CAPA turns a one-time defect report into a permanent improvement.
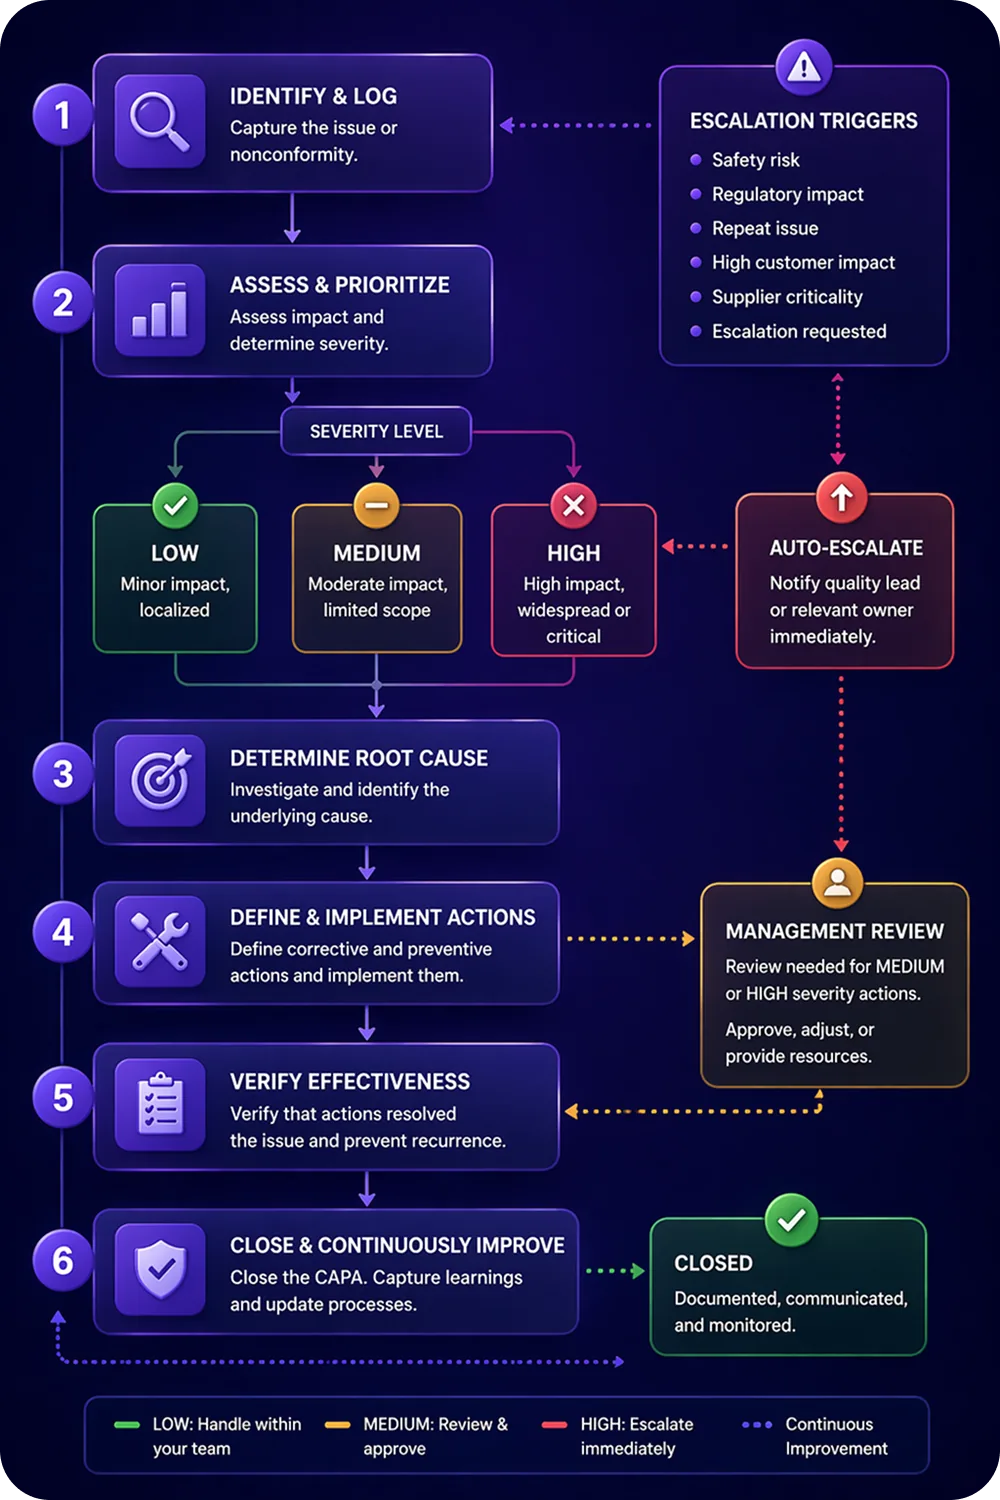
The CAPA workflow follows a standard pattern:
- Identify the issue. Triggered by an NCR, customer complaint, audit finding, or warranty claim pattern.
- Investigate root cause. Use structured methods (5 Whys, Fishbone diagram, Fault Tree Analysis) to find the underlying cause, not just the symptom.
- Define corrective action. Specific, measurable steps the supplier must take to fix the immediate problem.
- Define preventive action. Process or design changes that prevent the same defect from recurring.
- Implement and verify. Supplier implements the actions. The quality team verifies effectiveness through follow-up inspection or audit.
- Close and document. Record the outcome and update the supplier scorecard.
CAPA Timelines That Work
Vague deadlines produce vague results. Effective CAPA timelines are specific:
- Critical NCR: Containment within 24 hours. Root cause analysis within 5 business days. Corrective action implemented within 14 days. Effectiveness check at 30 and 60 days.
- Major NCR: Root cause analysis within 10 business days. Corrective action within 30 days. Effectiveness check at 60 days.
- Minor NCR: Documented in the supplier's quality file. Addressed in the next scheduled business review.
Common CAPA Failures
CAPA processes fail when:
- Root cause analysis is superficial. "Operator error" is not a root cause. Why did the operator make the error? Was training missing? Was the spec unclear?
- Corrective actions are too vague. "Improve quality control" is not actionable. "Add a second inspection checkpoint after the stitching station" is.
- No follow-up check. Without follow-up data showing the defect rate dropped, the CAPA is just paperwork.
- No consequences for missed deadlines. If suppliers routinely miss CAPA deadlines without impact on their scorecard or contract terms, the process loses teeth.
Supplier Scorecards: Measuring Performance
What Goes on a Supplier Scorecard?
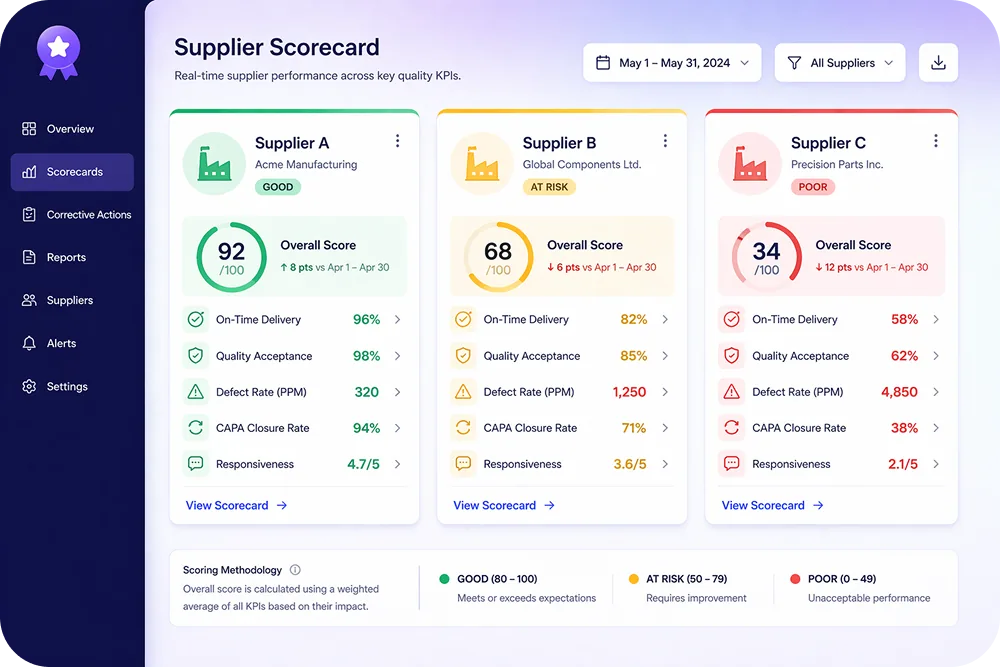
supplier scorecard is a regular evaluation of a supplier's quality, delivery, and responsiveness. Most teams run them monthly or quarterly. For quality issue reporting, the scorecard should track:
- Defect rate (PPM or percentage). Parts per million defective or percentage of units returned/rejected.
- NCR count and severity. Number of nonconformance reports filed, broken down by Critical, Major, Minor.
- CAPA closure rate. Percentage of corrective actions completed on time.
- CAPA effectiveness rate. Percentage of closed CAPAs where the defect did not recur within the verification window.
- Warranty claim cost. Total warranty costs attributed to this supplier's products.
- Return rate. Percentage of supplier's products returned by end customers for quality reasons.
- Response time. Average time from NCR issuance to supplier acknowledgment and root cause submission.
AI-powered supplier quality scoring automates much of this. It pulls defect data from returns, warranty claims, and inspections into a real-time scorecard. No manual data entry."
Scorecard Rating System
A simple traffic-light system works for most mid-sized operations:
- Green (80-100 points): Preferred supplier. Eligible for volume increases and new product lines.
- Yellow (60-79 points): Watch list. Improvement plan required. Monthly reviews instead of quarterly.
- Red (below 60 points): Probation. No new orders until performance improves. Risk of supplier replacement.
The key is that the scorecard is shared with the supplier regularly and tied to business consequences. A scorecard that only lives in the quality team's spreadsheet does nothing.
Using Returns and Warranty Data in Scorecards
Traditional supplier scorecards rely heavily on incoming inspection data. That captures manufacturing defects caught before products reach customers. But it misses the defects customers discover after weeks or months of use.
Feeding warranty claim data and customer return reasons into the scorecard gives a complete quality picture. A supplier might pass incoming inspection at 99.5% but generate a 12% warranty claim rate on the same product. Without post-sale data in the scorecard, that gap stays invisible.
With the integration to Business Central, resolving a claim in Claimlane automatically triggers all the necessary processes in our ERP. This means the customer service agent's work is complete the moment the claim is resolved in Claimlane.
Kasper Andersen, IT Director — Konges Sløjd
Supplier Audits: Verifying Quality at the Source
When to Audit
Audits should not be reserved for crisis moments. A structured audit schedule includes:
- Annual audits for all active suppliers.
- Triggered audits after a Critical NCR or a pattern of Major NCRs.
- Pre-qualification audits before onboarding a new supplier.
- CAPA verification audits to confirm corrective actions were actually implemented.
What to Audit
For supplier quality in retail and ecommerce, audits should cover:
- Incoming material controls. How does the supplier verify raw materials before production?
- In-process quality checks. Where are inspection points in the production line? What are the pass/fail criteria?
- Final inspection procedures. What sampling plan is used? What defect classification system?
- Document control. Are product specs up to date? Are work instructions accessible to operators?
- CAPA records. Are previous corrective actions documented and verified?
- Traceability. Can the supplier trace a finished product back to raw material batches?
Remote vs. On-Site Audits
On-site audits remain the gold standard, but remote audits have become viable for lower-risk suppliers. A remote audit uses video calls, shared document reviews, and photographic evidence. It works for document-heavy checks (CAPA records, specs, training logs) but is less effective for process observations.
For B2B warranty claims involving multiple retail partners, audit findings should be shared across the supply chain. Every partner benefits from the improvement.
Building the Full Quality Issue Reporting Workflow
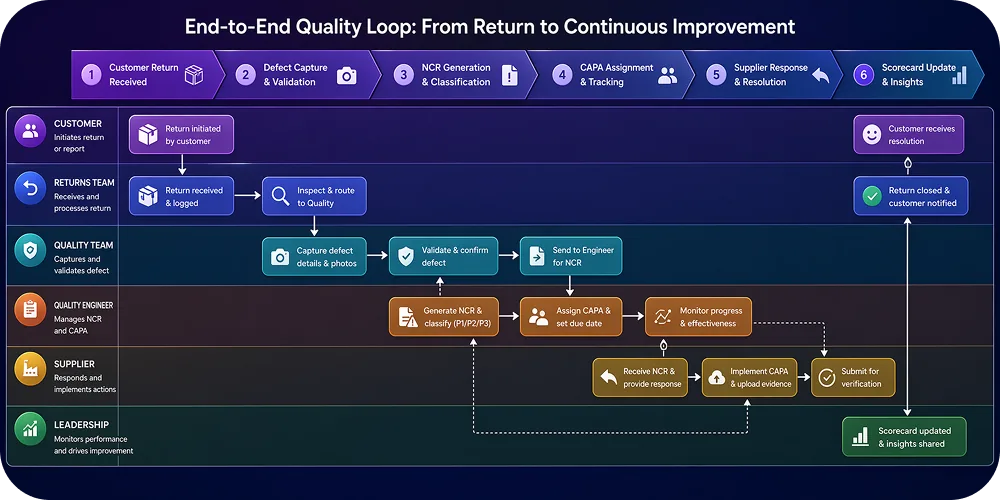
Step 1: Capture Quality Issues From Every Channel
Set up structured intake from all defect sources:
- Returns: Configure the returns portal to collect defect category, photos, and batch information at submission. A self-service portal makes this easy for customers.
- Warranty claims: Use a claims system that captures product failure mode, time-to-failure, and resolution cost.
- Inspections: Standardize inspection checklists with the same defect taxonomy used in returns and warranty.
Step 2: Route Issues to the Right Team
Not every defect needs the same response. Build routing rules:
- Customer complaints about cosmetic issues go to the returns team for processing.
- Repeated defects on the same SKU trigger an automatic NCR and route to the quality team.
- Safety-related defects trigger immediate containment and escalation to senior leadership.
Claimlane's workflow engine supports rule-based routing that automatically escalates quality issues based on defect type, volume, and severity.
Step 3: Generate NCRs and Track CAPAs
When defect thresholds are crossed (e.g., 3+ returns for the same defect on the same SKU within 30 days), automatically generate an NCR. Assign it to the supplier with a CAPA deadline based on severity.
Track CAPA progress in a centralized system where both the quality team and the supplier can see status updates, upload evidence, and log completed actions.
Step 4: Feed Results Into Supplier Scorecards
Every NCR, CAPA outcome, and defect trend should automatically update the supplier's scorecard. Monthly or quarterly scorecard reviews with suppliers should reference specific quality issues, CAPA performance, and trend data.
Step 5: Use Insights to Negotiate and Decide
Scorecard data drives supplier relationship decisions:
- Green suppliers get preferred terms and volume increases.
- Yellow suppliers get improvement plans with milestone deadlines.
- Red suppliers get cost-recovery claims (supplier chargebacks) and replacement sourcing begins.
Key Metrics for Supplier Quality Improvement
Leading Indicators
These metrics predict future quality performance:
- First-pass yield at incoming inspection. Percentage of supplier shipments that pass inspection without rework. Declining trends signal worsening quality.
- NCR response time. How quickly the supplier acknowledges and begins investigating a quality issue. Fast response correlates with better outcomes.
- CAPA on-time closure rate. Percentage of corrective actions completed by the agreed deadline.
Lagging Indicators
These metrics confirm whether quality improvements are working:
- Defective return rate by supplier. Percentage of a supplier's shipped units that customers return for quality reasons.
- Warranty claim cost by supplier. Total cost of warranty claims attributed to each supplier's products.
- Repeat defect rate. Percentage of CAPAs where the same defect recurs after the corrective action was supposedly implemented.
Returns analytics dashboards that combine return data with supplier attribution make these metrics accessible without manual data pulls.
How AI Improves Quality Issue Reporting
Artificial intelligence adds speed and pattern recognition to quality issue reporting.
Automated Defect Classification
AI models trained on product images can auto-classify defects from customer-submitted photos, eliminating the manual tagging that slows down NCR creation. Claimlane's AI Agent, the first AI agent purpose-built for warranty claims and returns, analyzes product images and videos, applies warranty rules per product and supplier, and recommends or auto-approves resolutions.
Predictive Supplier Risk Scoring
Machine learning models predict which suppliers are likely to see quality drop, based on leading indicators. Rising NCR frequency. Slower response times. Climbing return rates for specific product lines. Predictive warranty analytics gives sourcing teams early warning before a supplier quality problem becomes a customer experience crisis.
Automated CAPA Escalation
AI-driven workflows escalate overdue CAPAs automatically. They send reminders to suppliers. They flag suppliers whose performance is trending toward the Red zone."
Common Mistakes in Supplier Quality Reporting
Reporting Without Evidence
Telling a supplier "your product quality is declining" without attaching photos, batch data, and volume numbers gives them nothing to act on. Every quality report should include structured evidence. Platforms with a built-in self-service portal capture this evidence at the point of customer contact.
Treating All Suppliers the Same
Not every supplier needs the same level of quality oversight. Segment suppliers by risk:
- High-risk (critical components, new suppliers, suppliers with Red scorecard history): Monthly reviews, tighter CAPA deadlines, more frequent audits.
- Low-risk (proven suppliers with strong Green scorecard history): Quarterly reviews, lighter audit schedule.
No Connection Between Returns Data and Supplier Conversations
Many brands run returns processing and supplier quality as completely separate functions. The returns team handles refunds and exchanges. The quality team runs audits. Neither shares data with the other. Breaking this silo is the single highest-impact change for supplier performance improvement.
Industry Standards and Frameworks
Several industry standards guide supplier quality issue reporting:
- ISO 9001:2015 requires documented procedures for nonconformity management and corrective action (Clauses 8.7 and 10.2).
- IATF 16949 (automotive) adds supplier-specific quality management requirements including PPAP and supplier scorecards.
- ISO 13485 (medical devices) mandates CAPA processes with rigorous documentation.
- AS9100 (aerospace) requires supplier quality monitoring and performance tracking.
Even retailers not bound by these standards benefit from adopting the NCR and CAPA frameworks. The structure is proven. The International Organization for Standardization publishes the full ISO 9001:2015 requirements.
How Claimlane Supports Supplier Quality Reporting
Claimlane connects the full quality issue reporting chain: from customer-submitted defect evidence to supplier corrective actions.
Structured Defect Capture
Every return and warranty claim submitted through Claimlane's self-service portal includes structured defect data: photos, videos, defect category, serial numbers, and order details.
Automated Supplier Forwarding
Forward quality issues to suppliers with all evidence attached. Suppliers see the defect details, volume data, and action deadlines in one view, no email chains needed.
Cross-Functional Analytics
Claimlane's analytics combine return, warranty, and supplier resolution data into one dashboard. Quality, operations, and sourcing teams all see the same view.
AI-Powered Triage
Claimlane's AI Agent auto-classifies defects from customer-submitted images and recommends resolutions, speeding up the path from customer complaint to supplier NCR.
Integration With Existing Systems
Claimlane integrates with Shopify, WooCommerce, ERP systems (including Business Central, as Konges Sløjd demonstrated), and support platforms like Zendesk. Quality data flows between systems without manual exports.
Claimlane is rated 4.8/5 on G2 (read reviews).
.webp)

