
.webp)
Returns teams sit on the richest source of product quality data in most ecommerce and retail organizations. Every return with a defect reason code, every warranty claim with photos of a broken product, every customer message describing what went wrong contains intelligence that could prevent the next hundred returns of the same product.
The problem: most returns teams do not have a quality issue reporting tool designed for their workflow. They have returns management software that processes refunds and a support platform that closes tickets. The quality data embedded in those transactions gets processed and forgotten.
This guide explains how returns teams can use a quality issue reporting tool to categorize defects, track return reasons, build defect reporting workflows, and feed structured data into supplier quality processes that actually fix the root cause.
TL;DR
- Returns teams sit on the richest source of product quality data but most returns tools are built for refund processing, not quality reporting.
- A three-level return reason taxonomy turns every return into a structured quality data point for supplier scorecards and CAPA workflows.
- AI eliminates the classification bottleneck by auto-classifying defects from photos and descriptions.
- Claimlane connects returns data directly to supplier quality workflows, with AI defect classification, automated supplier forwarding, and built-in analytics.
Why Returns Teams Need Quality Issue Reporting Tools
The Data Returns Teams Already Have
Every return processed by a returns team contains quality signals:
- Return reason codes. "Defective," "not as described," "damaged in transit," "wrong item sent."
- Customer descriptions. Free-text explanations of what went wrong.
- Photos and videos. Visual evidence of defects, damage, or quality issues.
- Product identifiers. SKU, order number, purchase date, batch information.
- Resolution data. Refund, replacement, store credit, repair.
This data already exists in the returns workflow. The question is whether it flows into quality reporting or disappears into a closed ticket.
What Happens When Returns Data Stays Siloed
When returns data does not connect to quality reporting:
- Quality teams lack visibility. They rely on incoming inspection data and periodic audits, missing the defects customers discover after weeks of use.
- Suppliers never see the evidence. The photos a customer submitted with their return never reach the supplier responsible for the defect.
- Patterns go undetected. A 2% defect rate on a single SKU looks minor. But 2% across 10,000 units is 200 defective products and 200 unhappy customers.
- Return costs repeat. Without root cause correction, the same defects generate returns quarter after quarter. Understanding why customers return products is the first step toward reducing those returns.
Return Reason Categorization: The Foundation

Building a Return Reason Taxonomy
Effective return reason categorization goes beyond "defective" or "not satisfied." A quality-focused taxonomy includes:
Level 1: Return Category
- Product defect
- Shipping damage
- Wrong item received
- Not as described
- Sizing/fit issue
- Changed mind
- Other
Level 2: Defect Subcategory (for product defects)
- Material failure (fabric tear, component break, surface crack)
- Assembly defect (missing parts, loose connections, misalignment)
- Functional failure (does not work, intermittent malfunction)
- Cosmetic issue (scratches, stains, color mismatch)
- Safety concern (overheating, sharp edges, chemical smell)
Level 3: Severity
- Critical (safety risk or complete failure)
- Major (unusable for intended purpose)
- Moderate (usable but noticeably degraded)
- Minor (cosmetic only)
This three-level taxonomy turns every return into a structured quality data point. It feeds directly into defect severity grading frameworks used by quality teams.
Why Generic Return Reasons Fail
Many returns management systems offer only broad reason codes: "defective," "not as described," "other." These categories tell the warehouse team how to process the return but give the quality team nothing to work with.
If 500 products were returned as "defective" last month, the quality team still does not know:
- What kind of defect? Material? Assembly? Functional?
- Which component failed?
- Which supplier's products are affected?
- How severe are the defects?
A quality issue reporting tool for returns teams solves this by adding structured defect classification to the return intake process.
Building the Defect Reporting Workflow
From Return Request to Quality Report
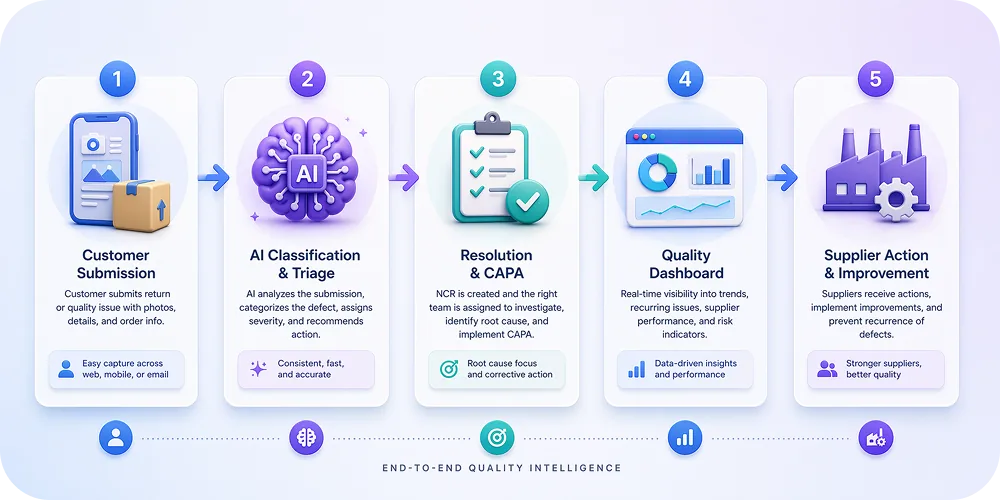
The ideal defect reporting workflow for returns teams follows five steps:
- Customer submits a return or claim. Through a self-service portal that collects structured data: defect category, severity indicators, photos/videos, and product identifiers.
- AI classifies the defect. Claimlane's AI Agent analyzes submitted images and descriptions to auto-classify the defect type and suggest severity. This removes the classification burden from returns agents.
- Returns team processes the resolution. Refund, replacement, or store credit based on the claim details. The customer experience is handled immediately.
- Quality data flows automatically. The structured defect data from the return feeds into quality dashboards. No manual re-entry. No separate quality ticket creation.
- Thresholds trigger supplier action. When defect volume or severity for a specific SKU or supplier crosses a threshold, the system automatically generates a quality report and forwards it to the supplier with all evidence attached.
This workflow means the returns team does not need to become quality engineers. They handle the customer resolution as usual. The quality issue reporting tool handles the data routing.
Integrating With Returns Management Software
Returns teams already use tools for processing returns. The quality issue reporting tool needs to integrate with these systems, not replace them:
- Shopify and WooCommerce: Claimlane integrates directly with these ecommerce platforms, pulling order data and product details automatically.
- ERP systems: For brands using Business Central or similar ERPs, claim resolutions in Claimlane can automatically trigger credit notes and inventory adjustments.
- Support platforms: Zendesk, Freshdesk, and similar tools can route support tickets with quality implications into the defect reporting workflow.
The integration should be invisible to the returns agent. They work in their normal tool. Quality data flows to the quality issue reporting platform automatically.
Product Quality Issue Tracking for Returns Teams
What to Track
A quality issue reporting tool for returns teams should track:
- Defect rate by SKU. Percentage of units sold that are returned for quality reasons. Flag SKUs exceeding the category benchmark.
- Defect rate by supplier. Which suppliers generate the most quality-related returns? Combine with warranty claim data for the full picture.
- Defect type distribution. Are most returns due to material failures? Assembly defects? Functional issues? This guides where to focus improvement efforts.
- Time-to-detection. How long after purchase does the defect surface? Short times suggest manufacturing defects. Long times suggest durability issues.
- Cost per defect. Total cost of processing the return (shipping, restocking, refund/replacement, customer service time) attributed to each defect type and supplier.
From Tracking to Action
Tracking alone is not enough. The quality issue reporting tool should trigger actions:
- Automatic alerts when a SKU's defect rate crosses a threshold.
- Supplier notifications with structured evidence when defect patterns emerge.
- CAPA requests with severity-based deadlines for recurring issues.
- Scorecard updates that reflect return-based quality data in supplier performance reviews.
Claimlane's analytics provide these dashboards and triggers, connecting returns data to supplier quality workflows without manual data transfers.
How AI Changes the Returns Quality Workflow
Automated Defect Classification
The biggest bottleneck in returns-based quality reporting is classification. Returns agents are trained to resolve customer issues quickly, not to perform detailed defect analysis. Asking them to classify every return into a three-level taxonomy slows down resolution and introduces inconsistency.
AI solves this by classifying defects automatically:
- Image analysis. AI examines customer-submitted photos to identify the defect type. A cracked plastic housing, a torn fabric seam, and a corroded metal connector each get classified differently without human review.
- Text analysis. Natural language processing parses customer descriptions to extract defect indicators. "The zipper broke on the first use" gets classified as a functional failure, severity Major.
- Pattern matching. AI recognizes when a new return matches a known defect pattern for the same SKU, automatically linking it to an existing quality investigation.
Claimlane's AI Agent handles all three: image analysis, text classification, and pattern matching. It is the first AI agent purpose-built for warranty claims and returns, trained specifically on product defect data rather than general-purpose image recognition.
Predictive Quality Intelligence
Once returns data is structured and classified, AI can predict future quality problems:
- Trend detection. Identify SKUs where defect rates are accelerating before they reach critical levels.
- Seasonal patterns. Detect quality issues that correlate with production batches, shipping conditions, or seasonal demand spikes.
- Supplier risk scoring. Predict which suppliers are trending toward quality deterioration based on returns, warranty, and response time data.
Predictive warranty analytics gives operations teams early warning for proactive intervention instead of reactive firefighting.
Claimlane gives us a full view of a customer's claim history and integrates with our Shopify data. That helps us judge: is this a loyal customer or a one-time buyer?
Tanja Munch, Head of Customer Service — Luksusbaby
Connecting Returns Data to Supplier Quality
The Returns-to-Supplier Bridge
The ultimate value of a quality issue reporting tool for returns teams is connecting customer-facing defect data to supplier-facing quality workflows. This bridge has three components:
- Evidence packaging. Customer-submitted photos, defect classifications, product identifiers, and volume data are packaged into a structured quality report.
- Supplier forwarding. The report is sent to the supplier through a trackable channel with a clear corrective action request and deadline. Forward to supplier through Claimlane handles this automatically.
- Response tracking. The supplier's investigation, root cause analysis, and corrective action plan are tracked in the same system, creating a complete audit trail from customer complaint to supplier fix.
Supplier Scorecards From Returns Data
Returns data should feed directly into supplier quality scorecards:
- Return rate by supplier. What percentage of a supplier's products are returned for quality reasons?
- Defect cost by supplier. Total cost of quality-related returns attributed to each supplier.
- Response time. How quickly does the supplier acknowledge and act on quality reports from returns data?
- Repeat defect rate. After a corrective action, does the same defect continue appearing in returns?
AI-powered supplier quality scoring automates these scorecards by pulling data from returns, warranty claims, and supplier responses into a single performance view.
Using Returns Data for Supplier Negotiations
Structured returns data gives brands leverage in supplier conversations:
- Cost recovery. Document the exact cost of quality-related returns and present it during supplier chargeback discussions.
- Contract terms. Use defect rate data to negotiate quality guarantees, warranty cost sharing, and penalty clauses.
- Sourcing decisions. Compare supplier quality performance using returns-based data to inform new product sourcing.
Without structured data, these conversations become subjective. With it, they become data-driven negotiations.
Quality Assurance Reporting Platform Features for Returns Teams
Must-Have Features
A quality assurance reporting platform designed for returns teams needs:
- Structured defect intake. A self-service portal that captures defect data (photos, category, severity) at the point of return.
- AI-powered classification. Auto-classify defects from images and text to reduce manual effort.
- Returns management integration. Connect to Shopify, WooCommerce, ERP systems, and support platforms.
- Automated supplier forwarding. Route quality reports to suppliers with evidence attached.
- Quality dashboards. Track defect rates, cost per defect, supplier performance, and trends.
- CAPA tracking. Monitor corrective action progress and effectiveness.
- Workflow automation. Rule-based routing, escalation, and notification.
Nice-to-Have Features
- Cross-border returns support. Handle returns across EU markets with multi-language portals and regulatory compliance.
- Predictive analytics. AI-driven quality risk forecasting.
- Custom reporting. Build reports tailored to specific supplier review meetings.
- Audit trail. Full history of every quality interaction for compliance and dispute resolution.
Case Study: From Email to Structured Quality Reporting
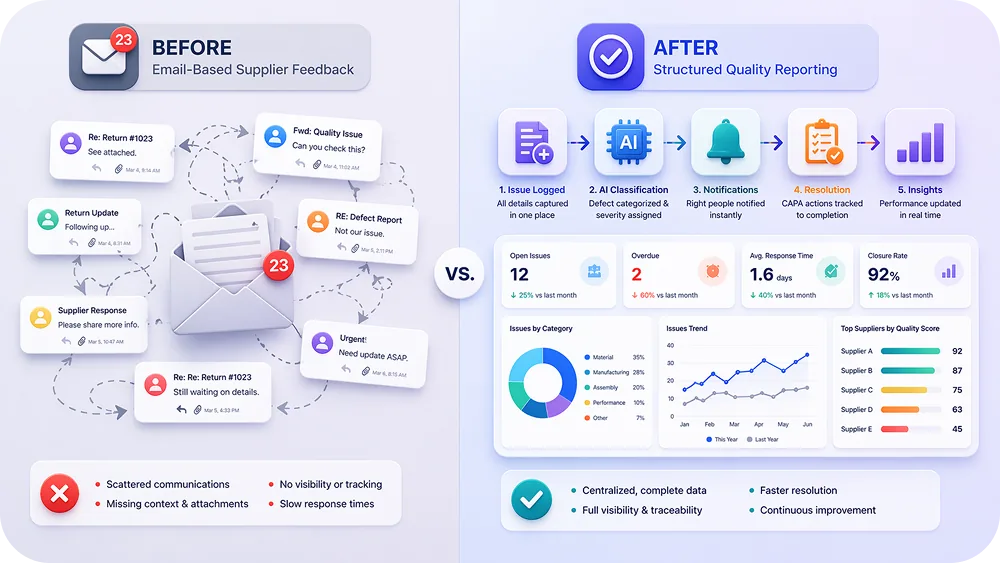
The Problem
A mid-sized fashion brand processes 3,000 returns per month across multiple product categories and suppliers. Returns agents classify returns as "defective" or "not defective" and process refunds. Quality complaints are forwarded to suppliers via email with varying levels of detail. Suppliers respond inconsistently. The same defects recur season after season.
The Solution
The brand implements a quality issue reporting tool integrated with their existing returns workflow:
- Customers submit returns through a self-service portal with structured defect fields and photo upload.
- AI auto-classifies defects, reducing agent handling time.
- Quality dashboards surface defect patterns by SKU, supplier, and defect type.
- Automated alerts notify the quality team when defect thresholds are crossed.
- Structured quality reports are forwarded to suppliers with evidence and CAPA deadlines.
The Results
- 40% reduction in time spent per return (AI handles classification).
- 3 previously undetected defect patterns identified in the first month.
- Supplier response time drops from an average of 12 days to 4 days (structured reports vs. emails).
- 15% reduction in quality-related returns over two quarters (suppliers fixing root causes).
- Full cost attribution: the brand can now calculate the exact cost of each supplier's quality failures.
Claimlane's Self-Service Portal has revolutionized how our customers submit their requests and eliminated the need for phone calls and email exchanges.
Adnan Baessa, Head of Operations — Cult
Getting Started: Implementation for Returns Teams
Week 1-2: Define the Taxonomy
- Map current return reason codes to the three-level taxonomy (Category, Subcategory, Severity).
- Identify which return reasons indicate quality issues vs. preference changes.
- Define defect thresholds that should trigger supplier notifications.
Week 2-3: Configure the Tool
- Set up the self-service portal with defect classification fields.
- Connect integrations (ecommerce platform, ERP, support tools).
- Configure workflow rules for routing and escalation.
- Set up supplier forwarding templates.
Week 3-4: Train and Launch
- Train returns agents on the new classification workflow (minimal change: AI handles most classification).
- Brief suppliers on the new structured reporting format.
- Go live with parallel processing for the first week.
Month 2+: Optimize
- Review defect classification accuracy and adjust AI models.
- Analyze first month's quality data for patterns.
- Hold first supplier review meeting using returns-based quality data.
- Refine thresholds and workflows based on real results.
Claimlane supports this timeline: most brands go live within 2-4 weeks with Shopify and WooCommerce plug-and-play integrations. Book a demo to see how the returns-to-quality workflow fits the team's setup.
Claimlane is rated 4.8/5 on G2 (read reviews).
.webp)

